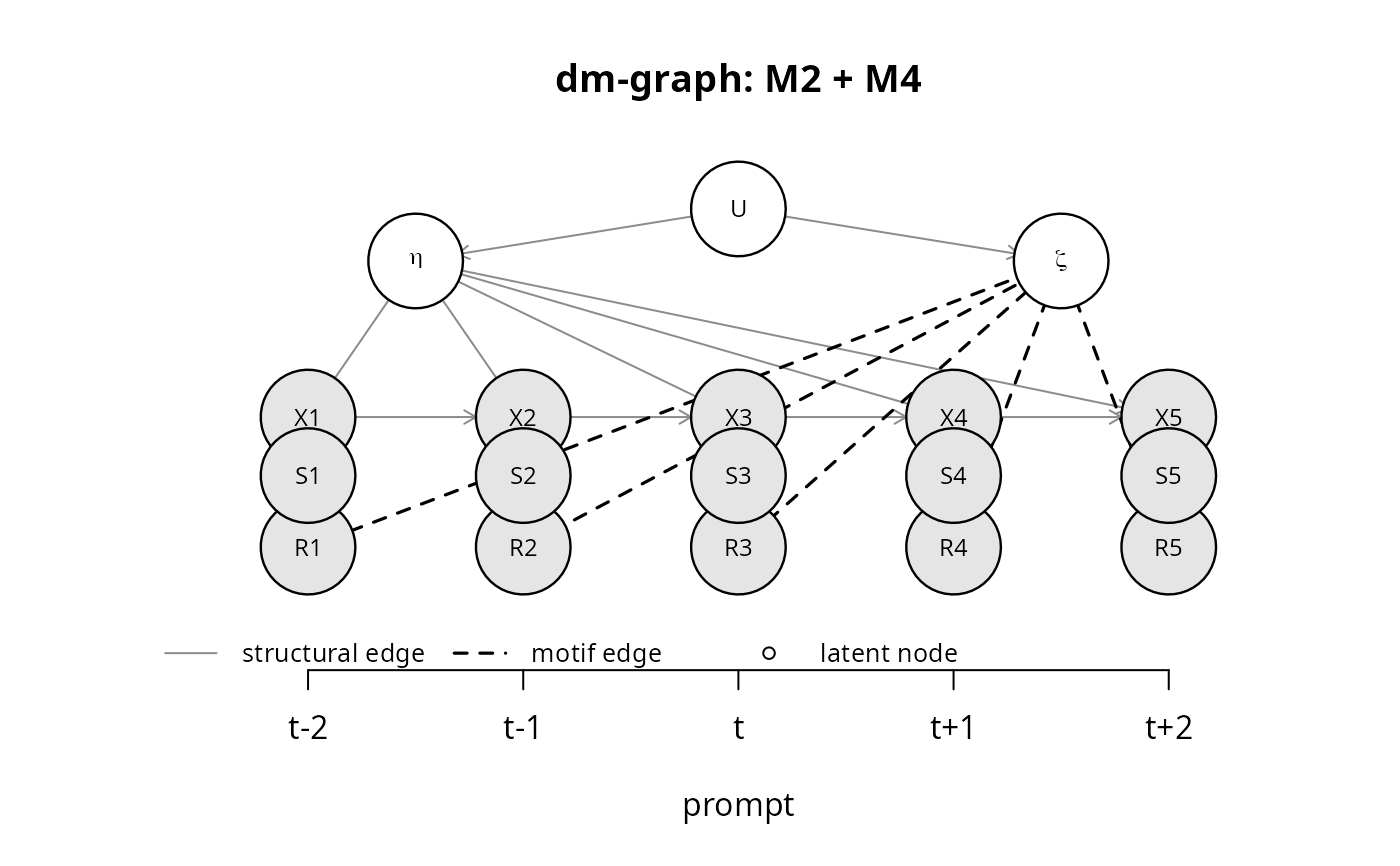
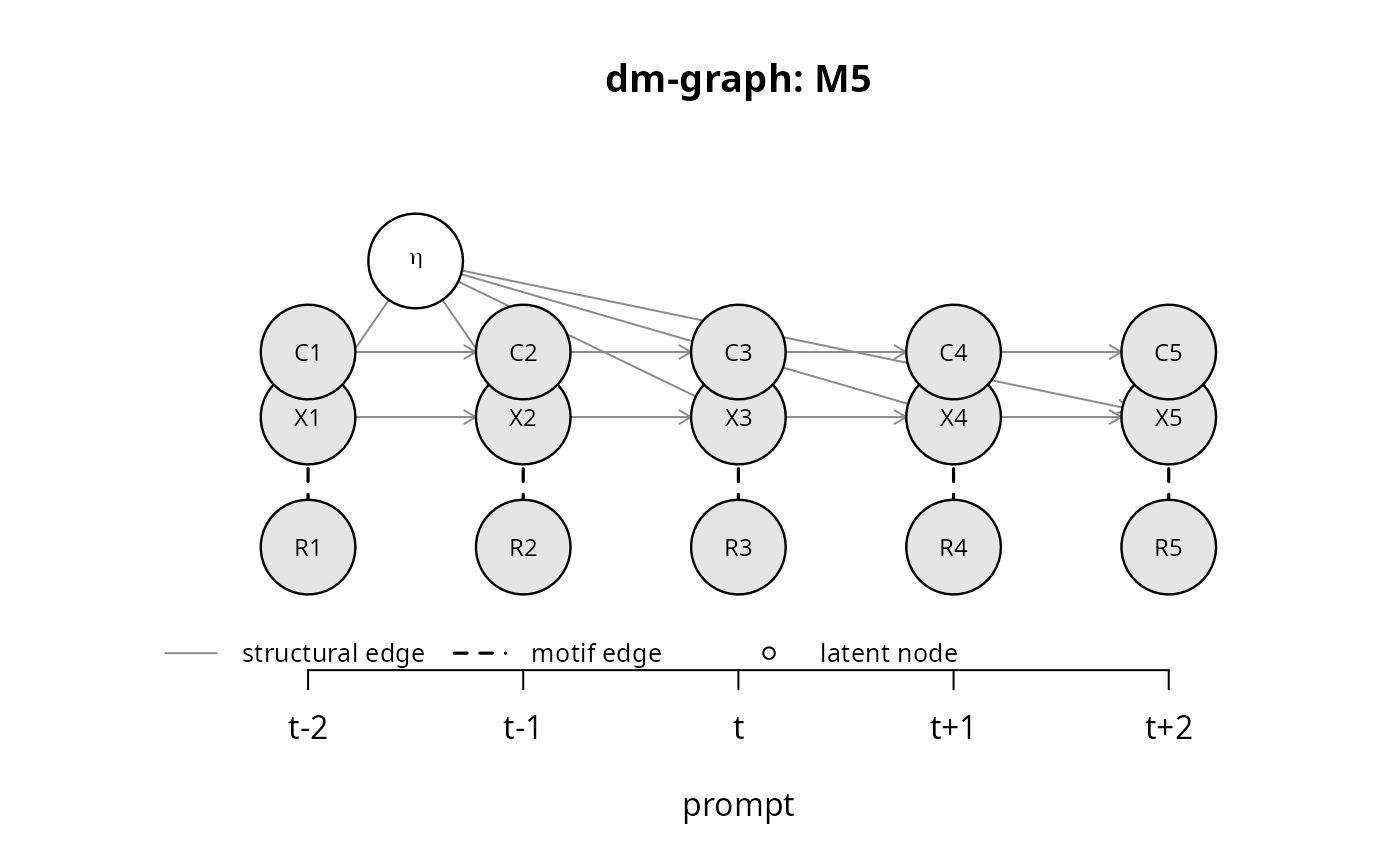
Draws the unrolled graph with prompts on the horizontal axis and node types in rows (person-level latents on top, then context, states, sensor, response indicators and probes). Structural edges are gray, edges added by the declared motifs are black and dashed, so the plot remains readable in grayscale. Latent nodes are drawn as open circles.
Usage
# S3 method for dm_graph
plot(x, ...)