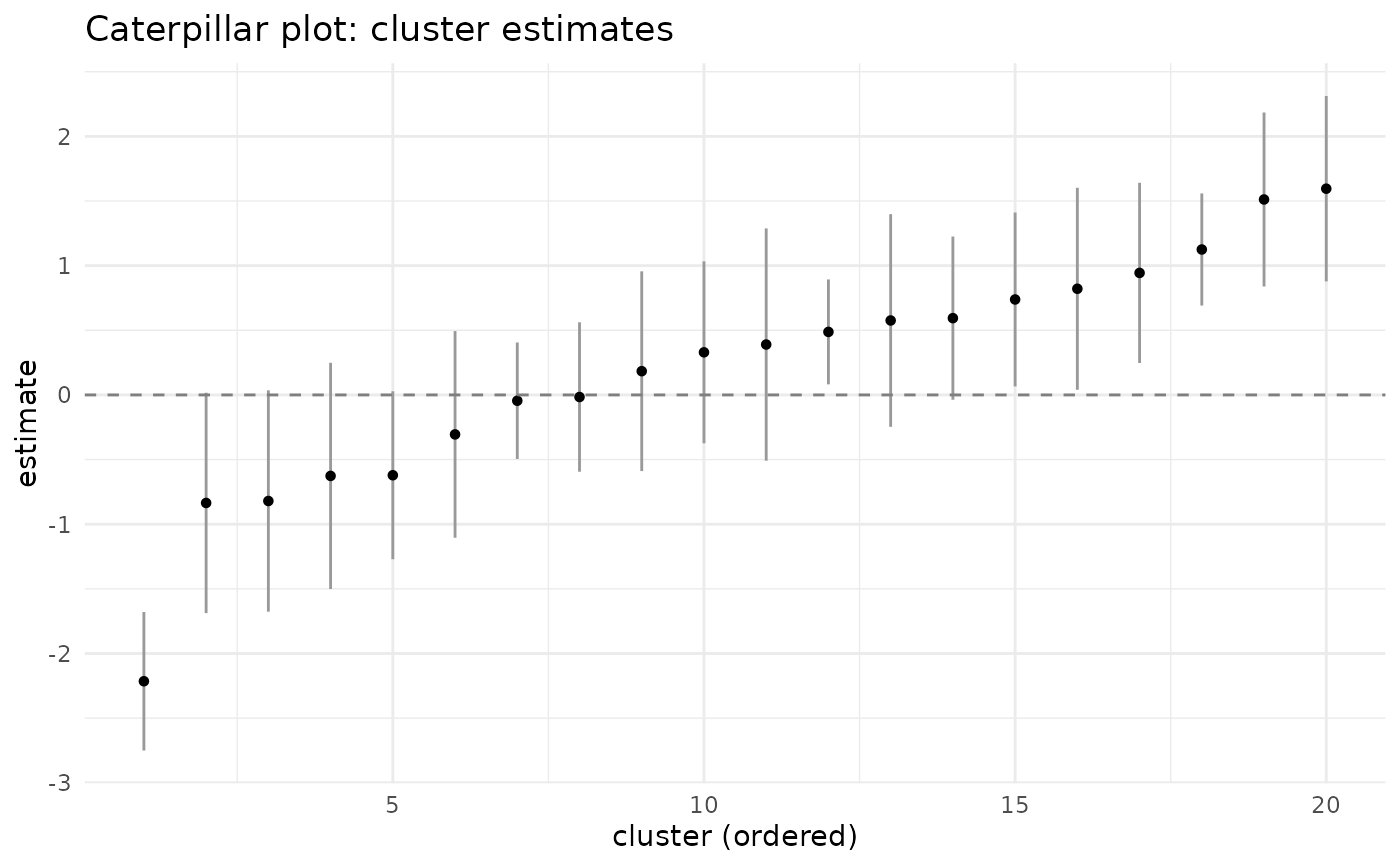
Renders the caterpillar plot implied by a random-coefficient vertex: cluster-level estimates ordered by value with optional uncertainty intervals, the canonical display for inspecting between-cluster variation and shrinkage. The input is the estimated deviations, which the modelling package supplies after fitting; the diagram object names the display, this function draws it.
Usage
umg_caterpillar(
  estimates,
  se = NULL,
  level = 0.95,
  title = "Caterpillar plot: cluster estimates"
)Examples
set.seed(1)
if (requireNamespace("ggplot2", quietly = TRUE))
  umg_caterpillar(rnorm(20), se = runif(20, 0.2, 0.5))