Skip to contents

Each model below is one line of code. The point of the gallery is that adopting the grammar for a new model is a matter of editing a near neighbour rather than starting from the definition. Every builder returns a umg object that passes umg_validate() by construction and can be re-rendered with plot(), umg_ggplot(), umg_to_tikz(), or umg_to_dot().
Measurement models

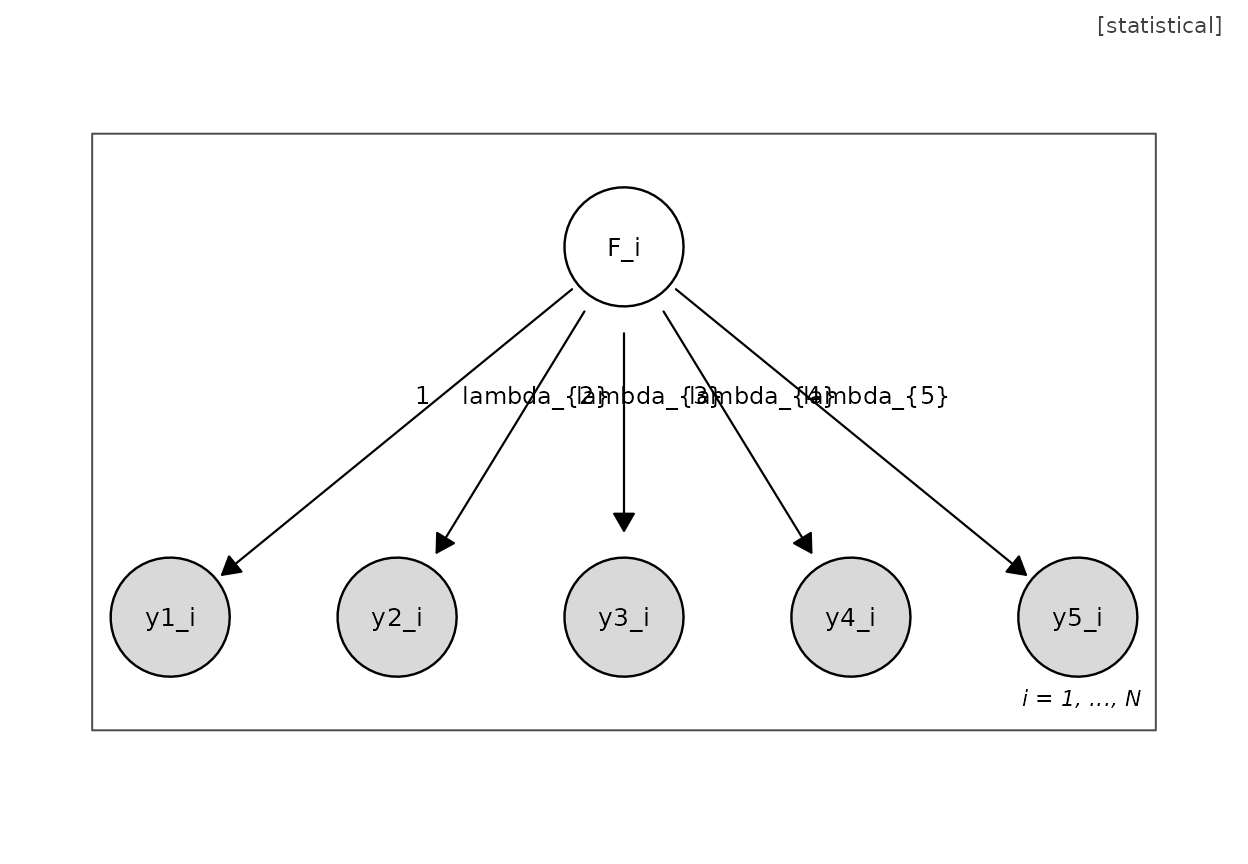
Reflective factor (CFA)

plot(umg_factor("F", paste0("y", 1:5)))

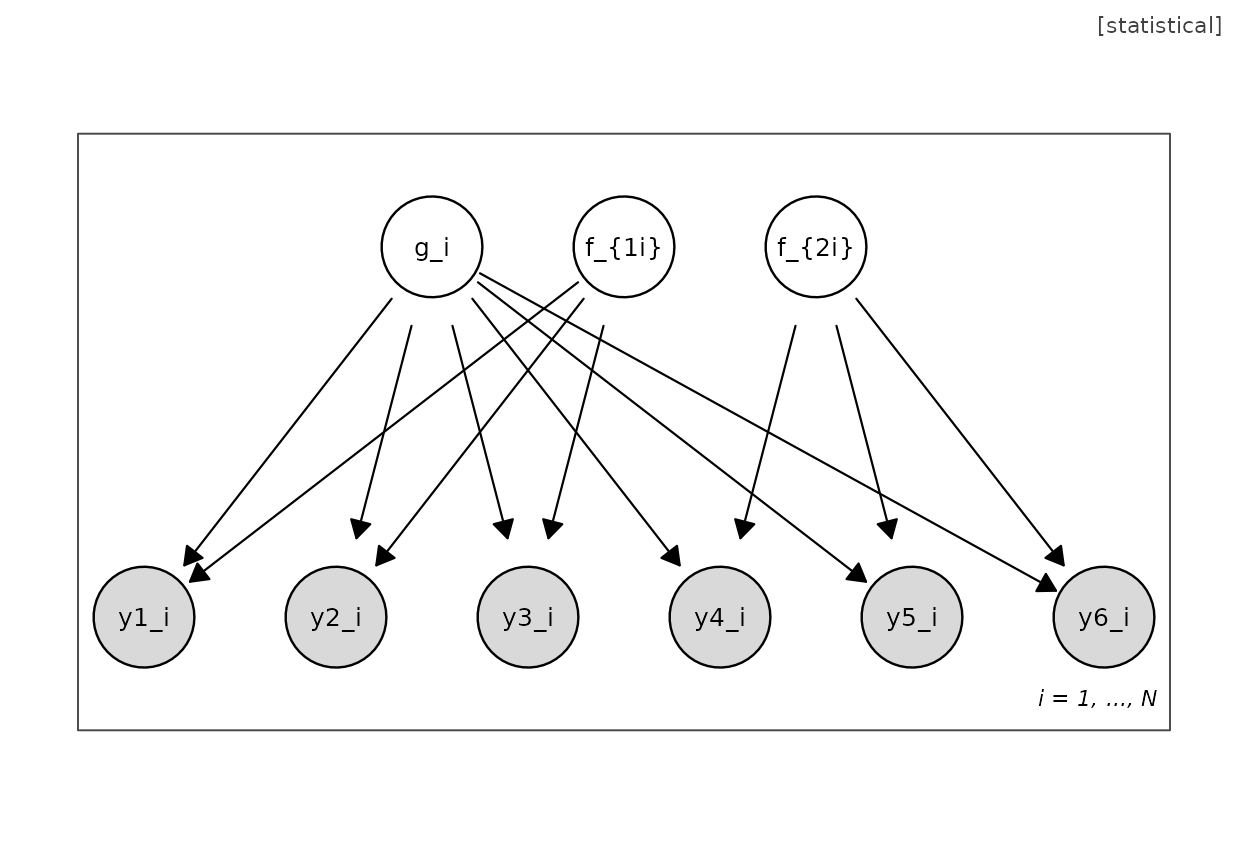
Bifactor

plot(umg_bifactor(paste0("y", 1:6),
                  groups = list(g1 = paste0("y", 1:3),
                                g2 = paste0("y", 4:6))))

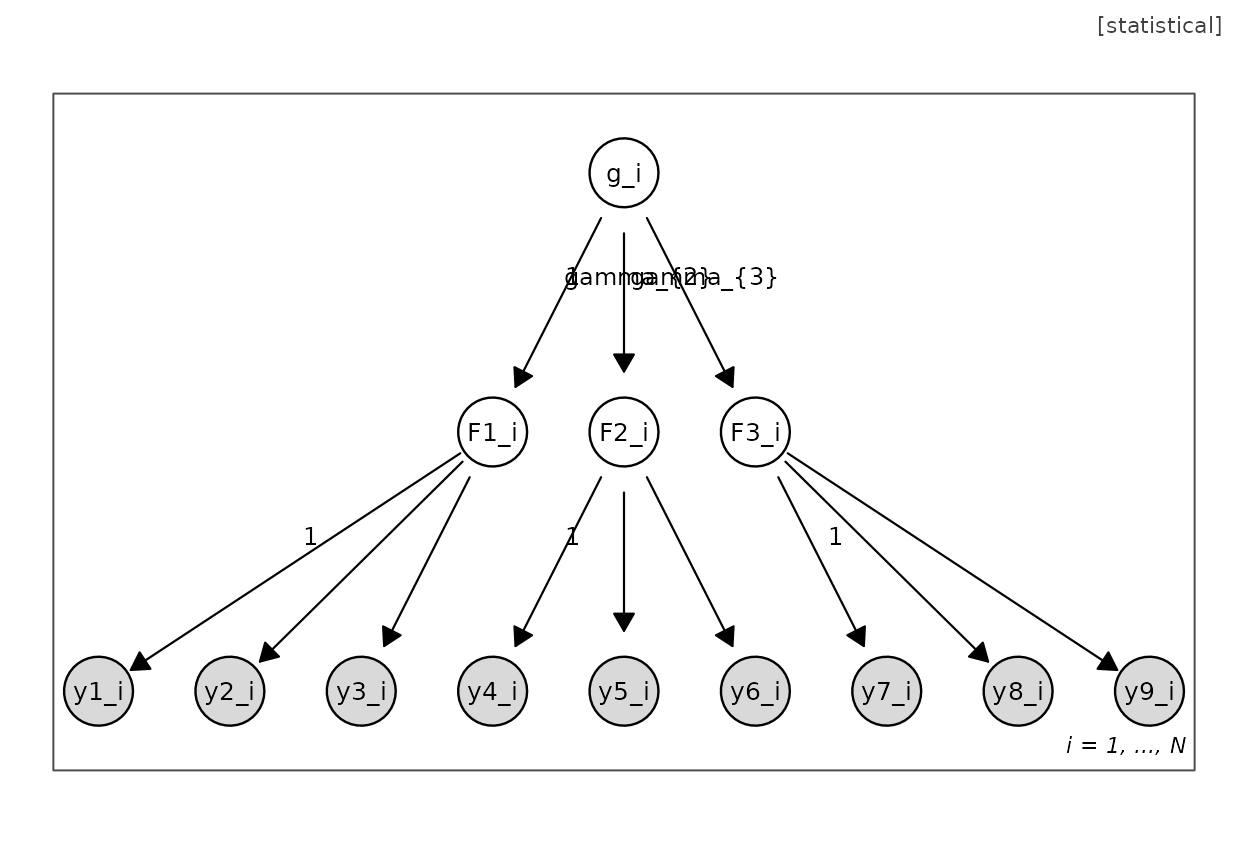
Second-order factor

plot(umg_secondorder(list(F1 = paste0("y", 1:3),
                          F2 = paste0("y", 4:6),
                          F3 = paste0("y", 7:9))))

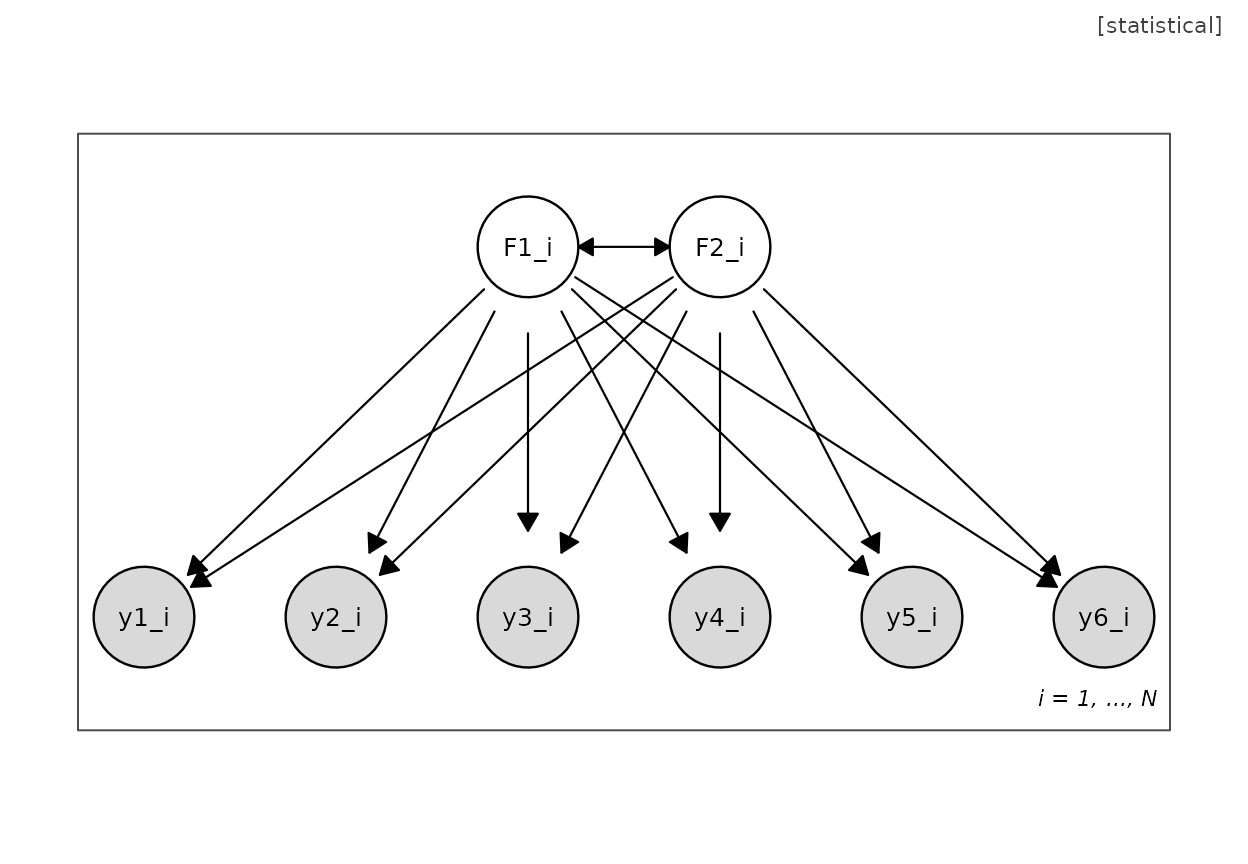
Exploratory SEM (full cross-loadings)

plot(umg_esem(c("F1", "F2"), paste0("y", 1:6)))

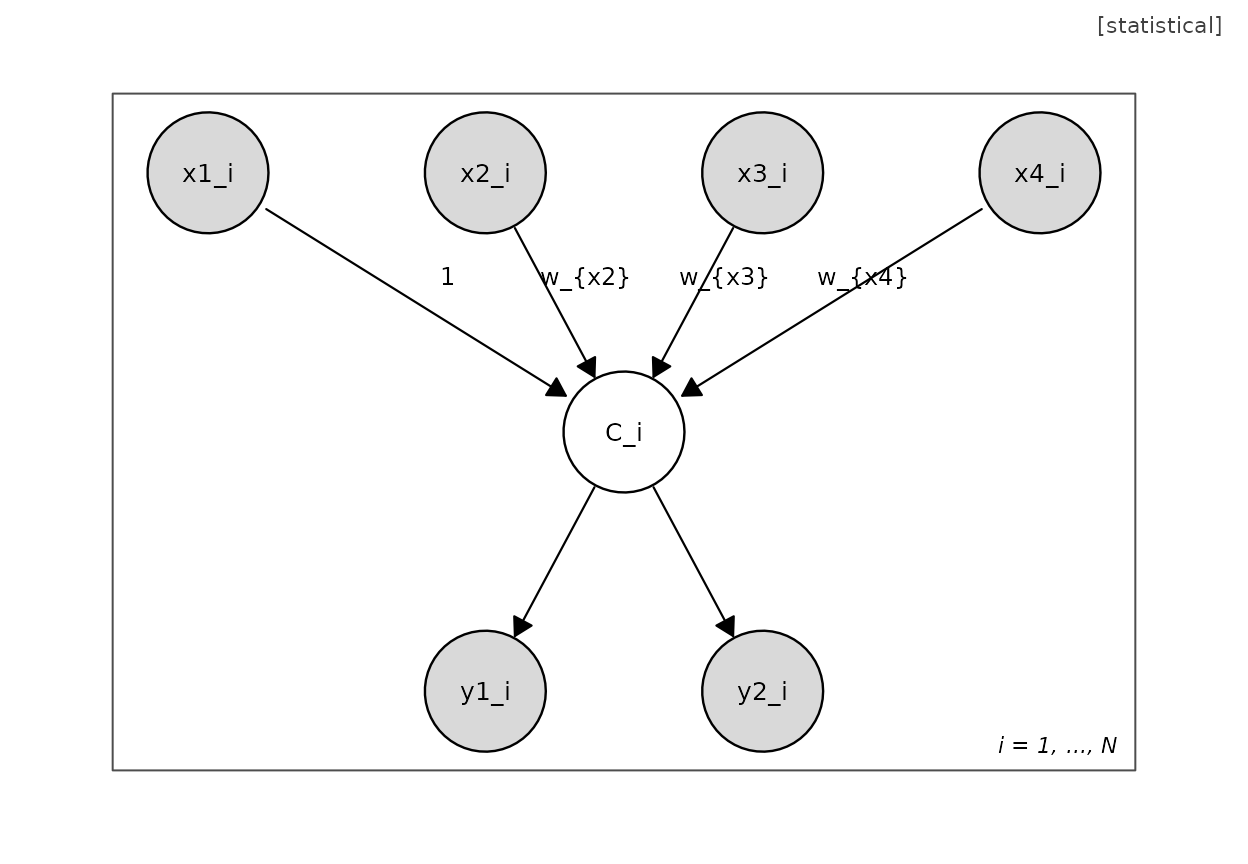
Formative measurement and MIMIC

plot(umg_formative(paste0("x", 1:4), outcomes = c("y1", "y2")))

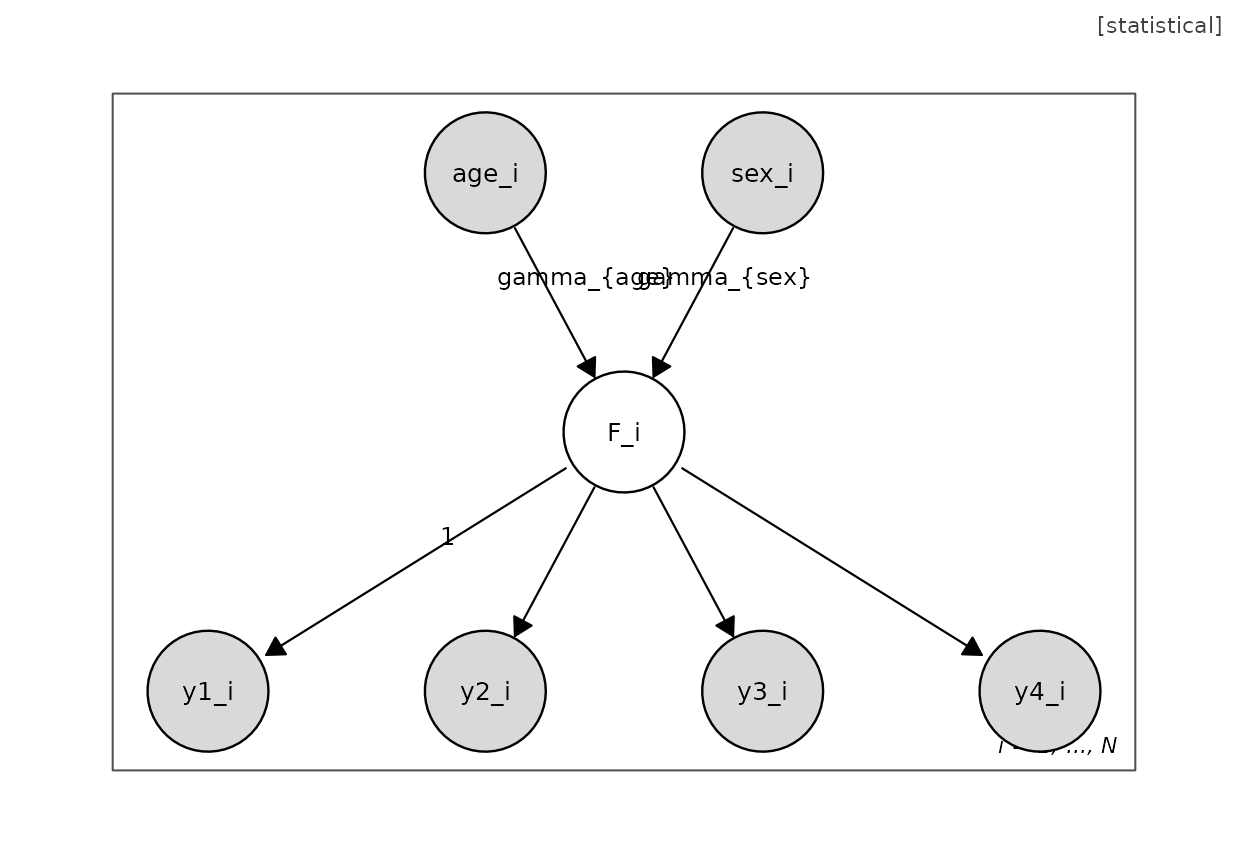
plot(umg_mimic(c("age", "sex"), paste0("y", 1:4)))

Item response models

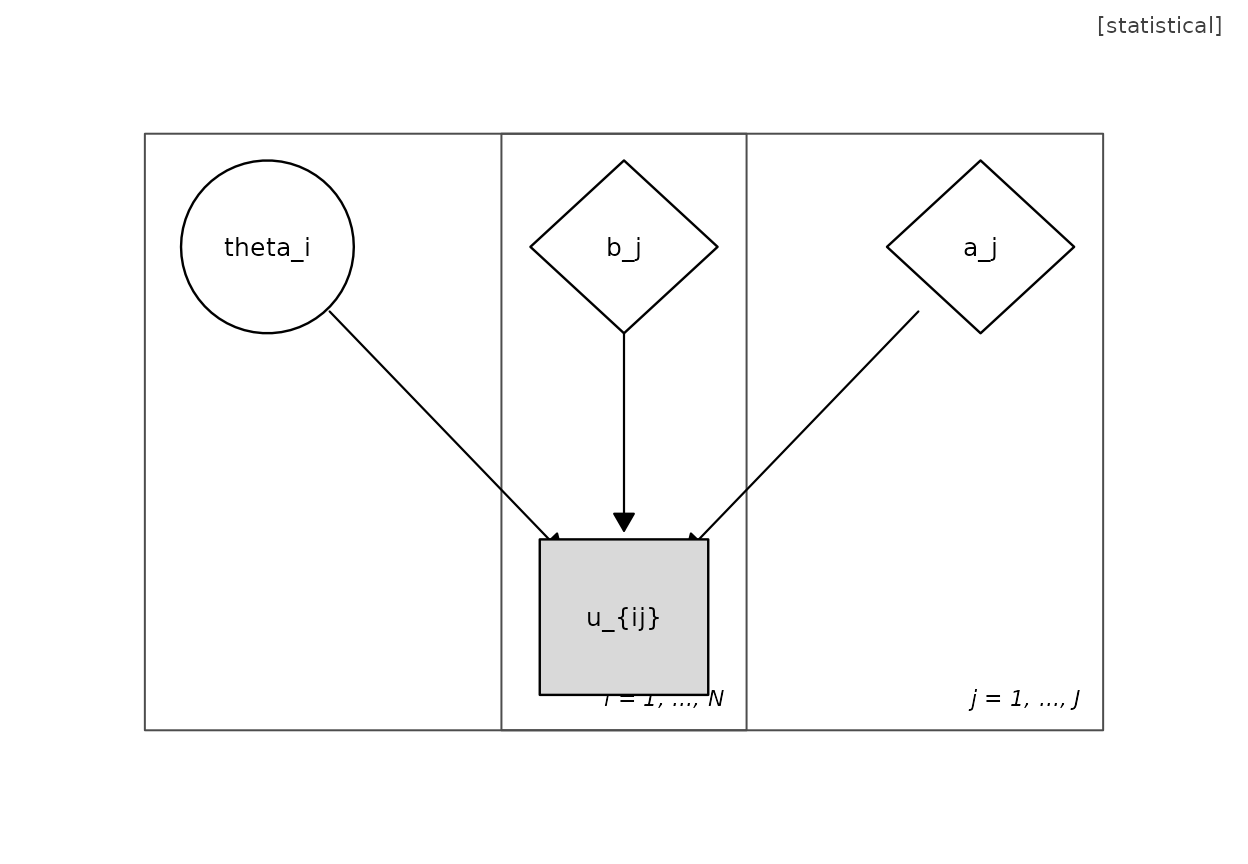
plot(umg_irt("2PL"))

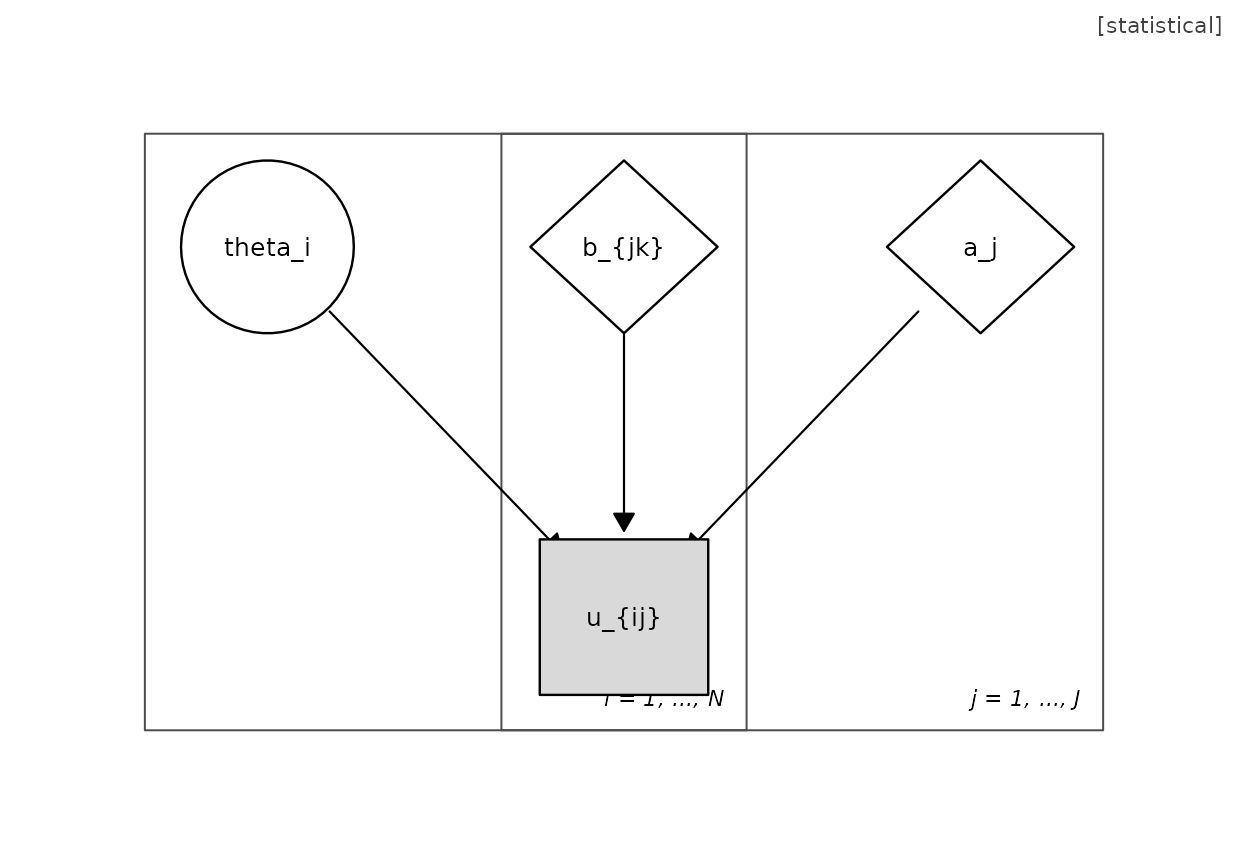
plot(umg_irt("graded"))     # graded response model

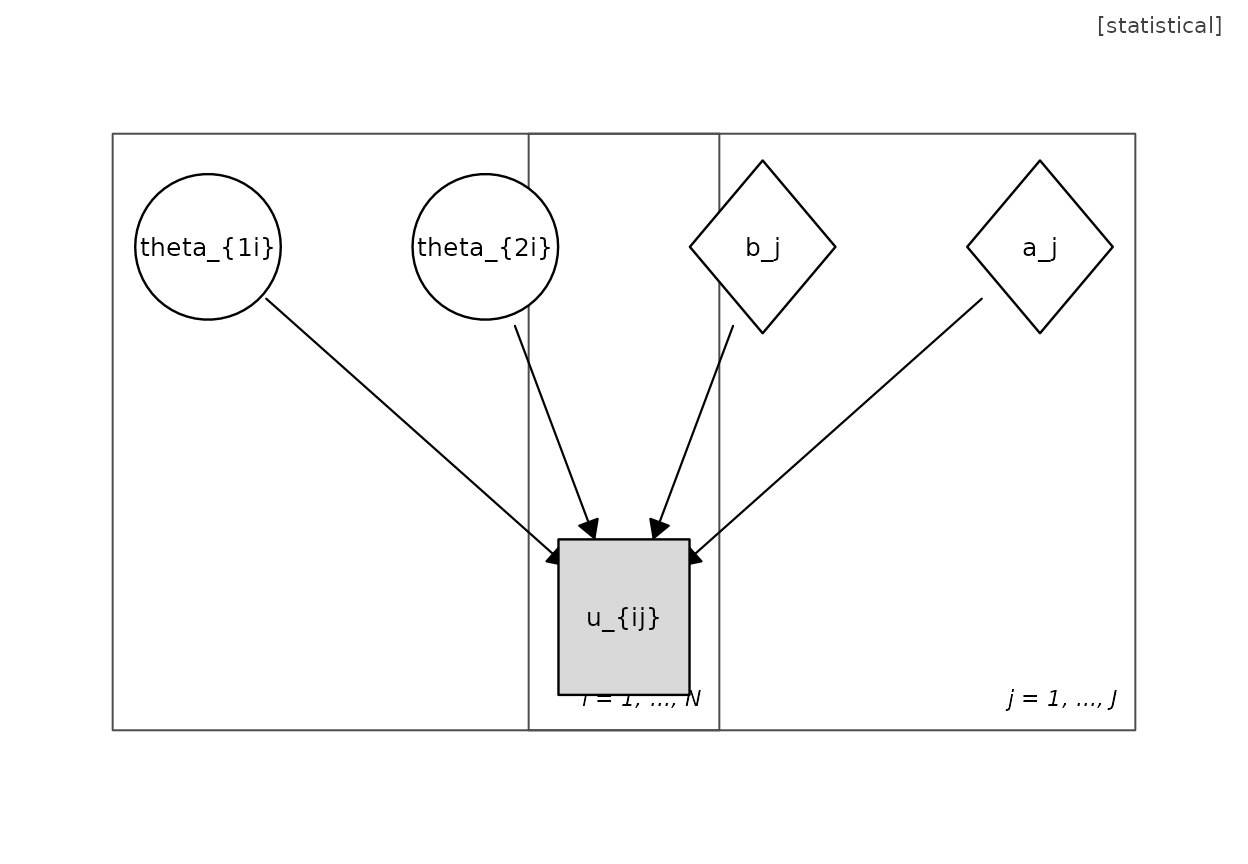
plot(umg_irt("2PL", n_dim = 2))  # multidimensional IRT

The diagnostic classification model combines latent categorical attributes with the crossed-plate measurement structure:
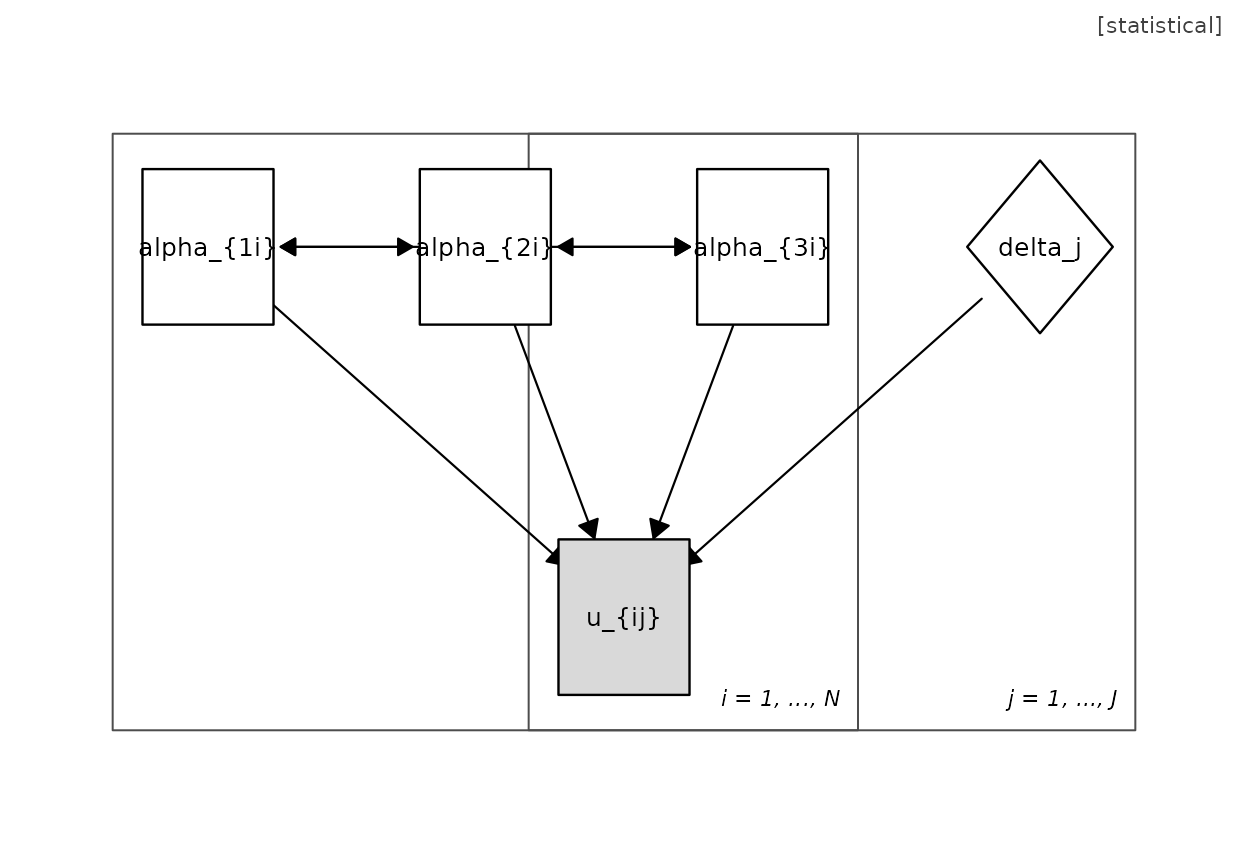
Q <- rbind(c(1, 1, 0, 0, 1, 0),
           c(0, 1, 1, 0, 0, 1),
           c(0, 0, 1, 1, 1, 1))
plot(umg_dcm(Q))

Hierarchy, growth, and longitudinal models

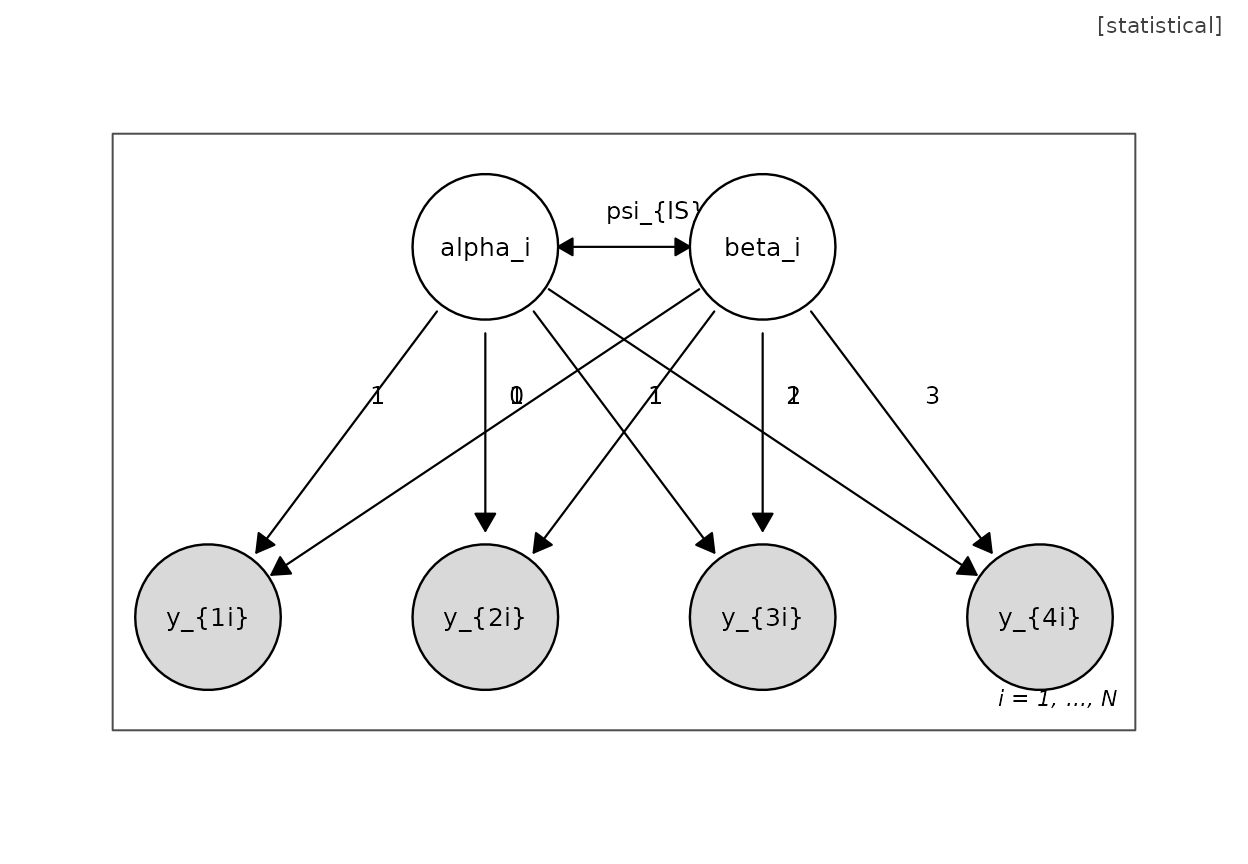
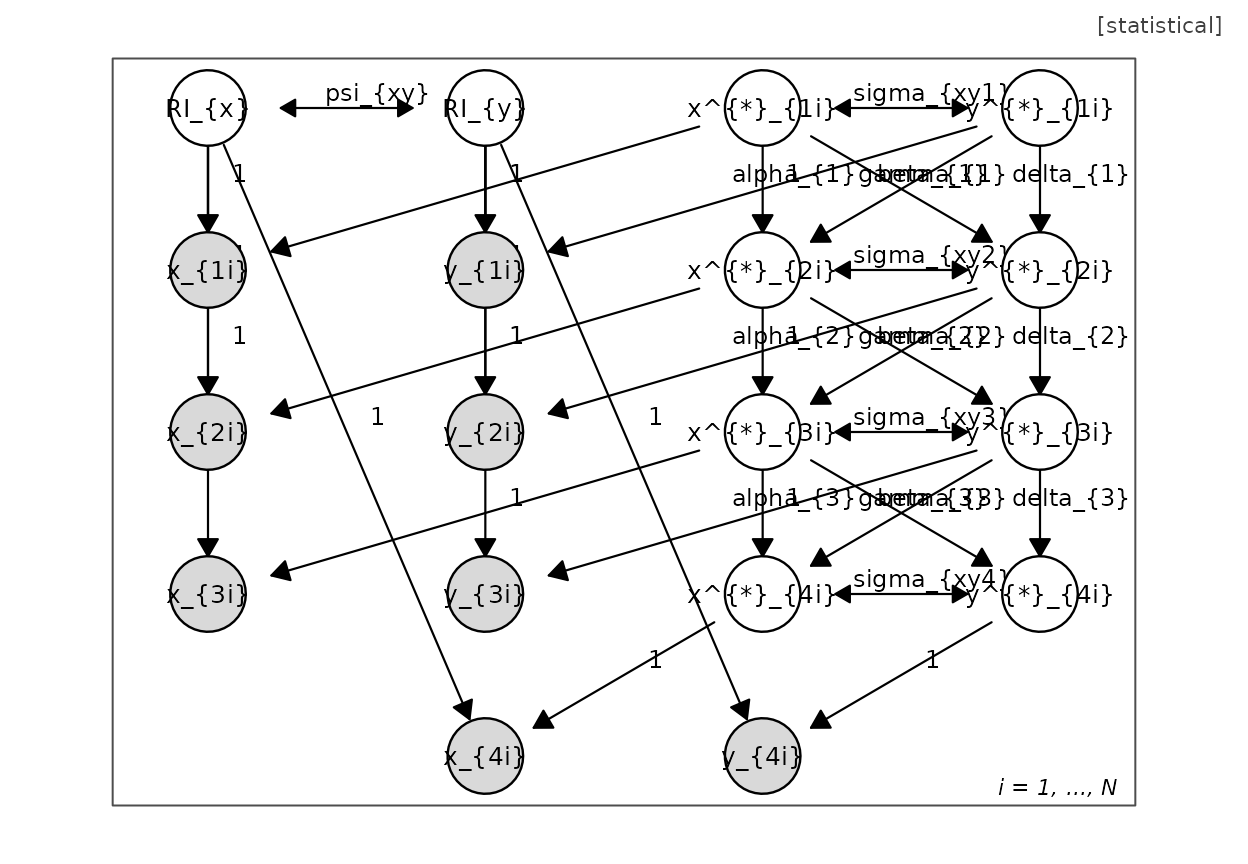
plot(umg_riclpm(waves = 4))   # random-intercept cross-lagged panel
Mixtures

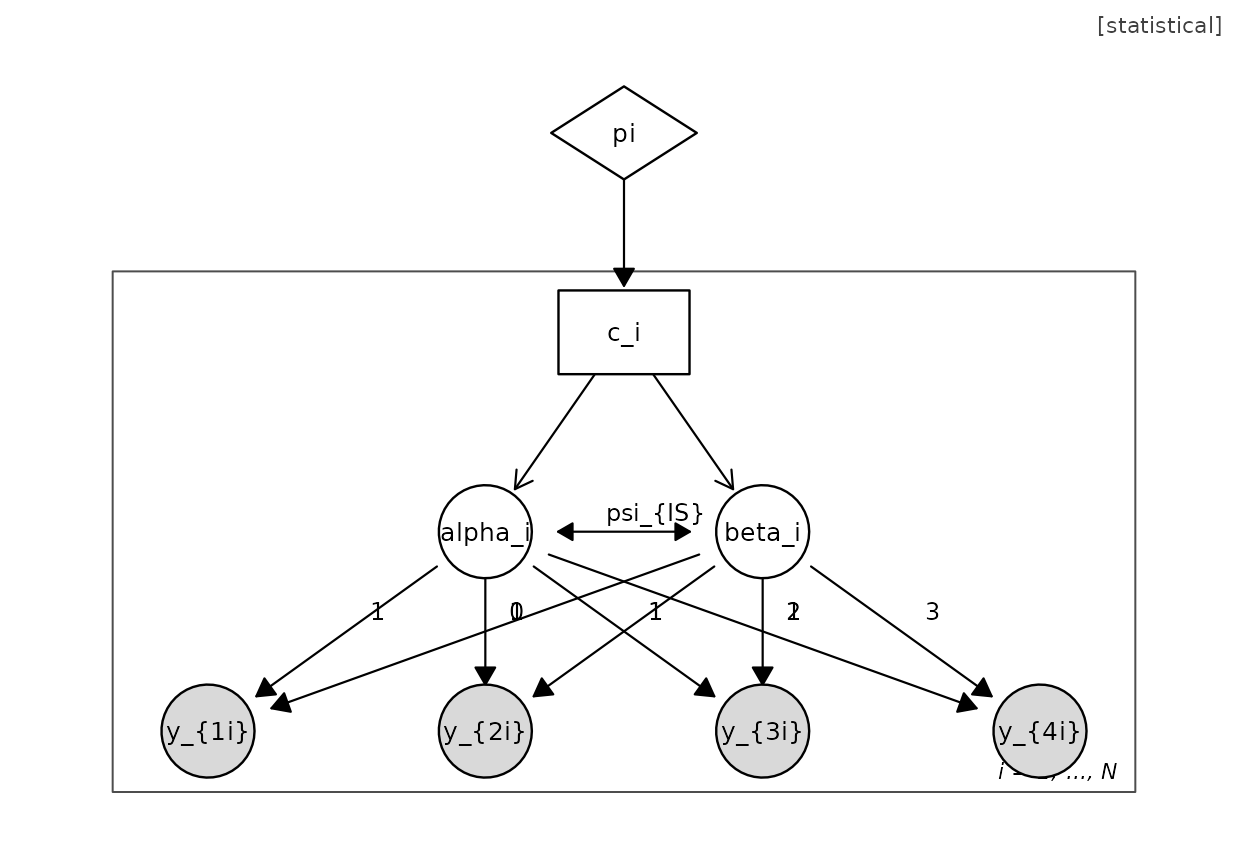
A growth mixture model is the composition of a growth motif and a mixture wrapper:

plot(umg_mixture(umg_growth(4), targets = c("I", "S")))
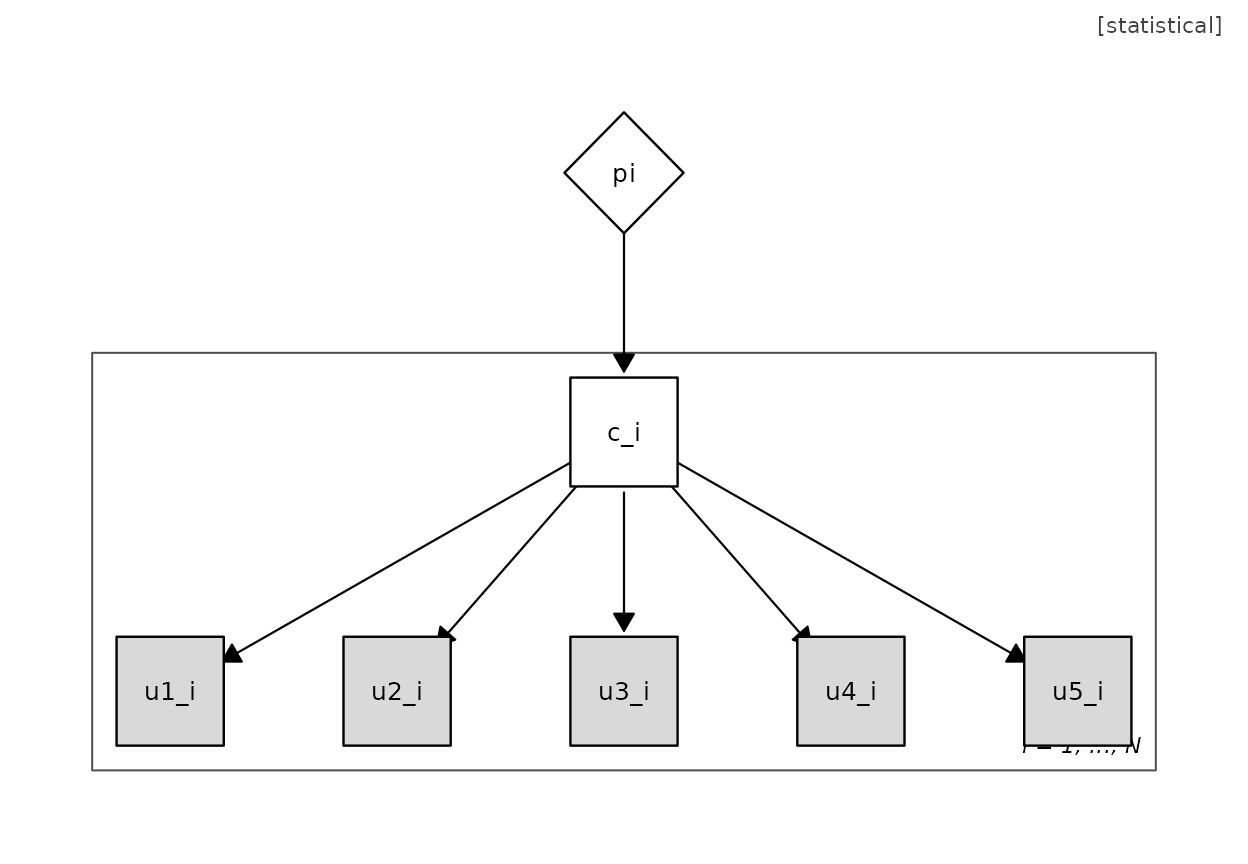
plot(umg_lca(paste0("u", 1:5)))   # latent class analysis

Networks

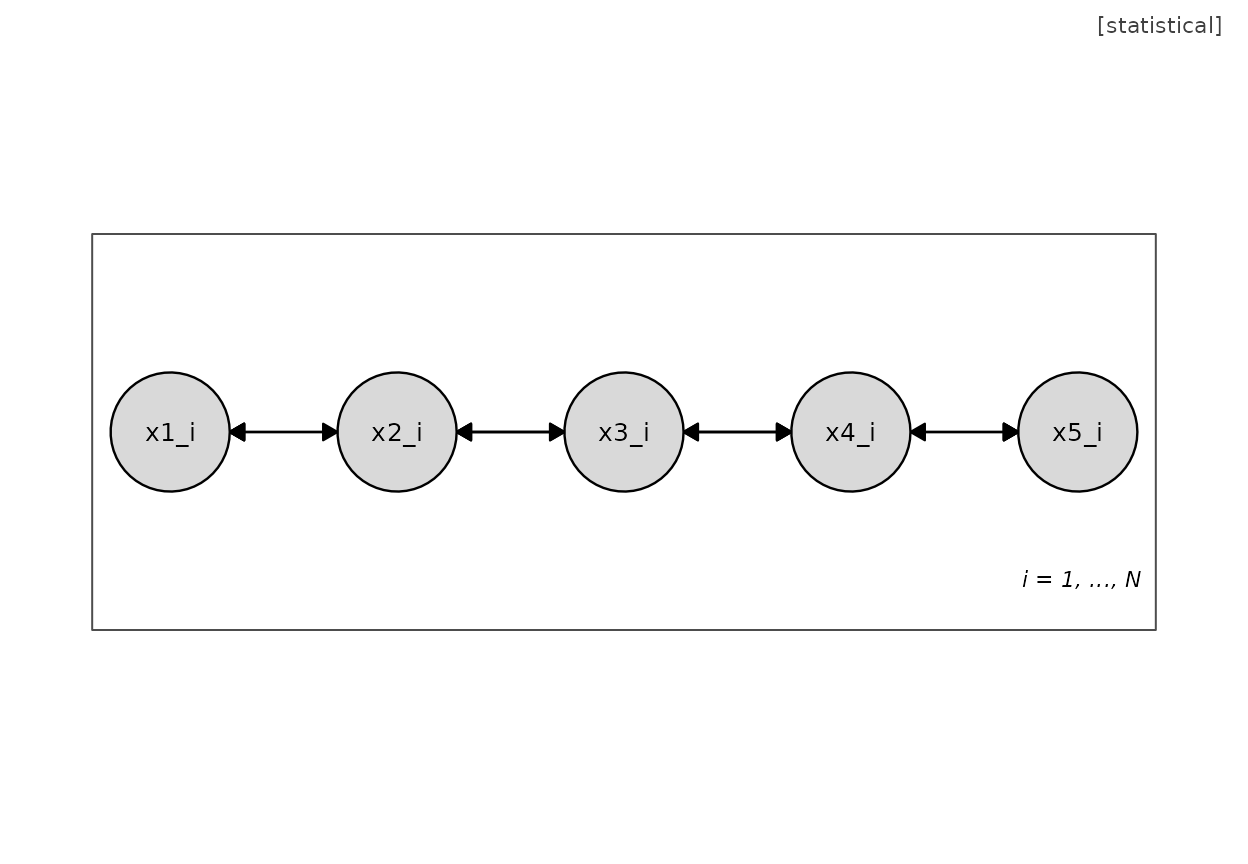
plot(umg_network(paste0("x", 1:5)))

General SEM assembler

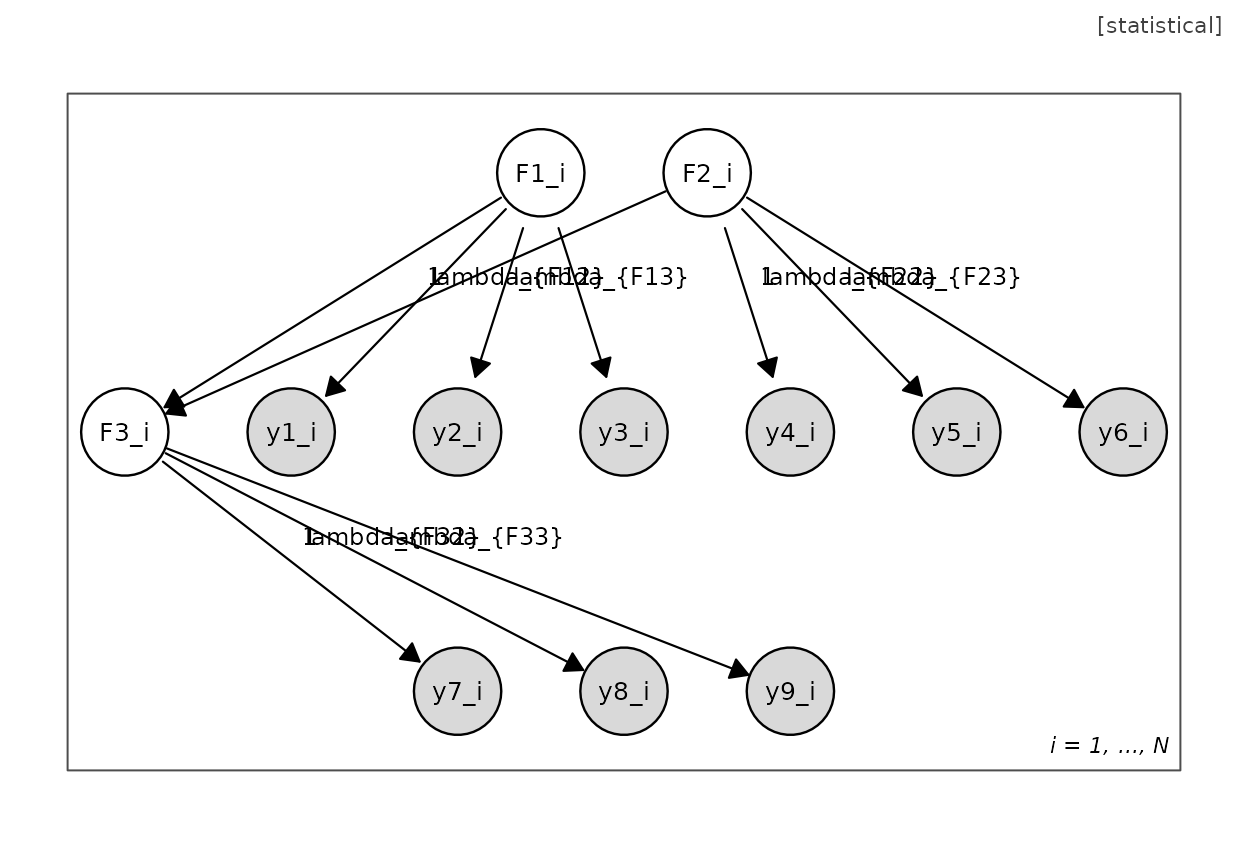
When no single-purpose motif fits, assemble a model from a measurement and a structural specification:

m <- umg_sem(
  measurement = list(F1 = paste0("y", 1:3),
                     F2 = paste0("y", 4:6),
                     F3 = paste0("y", 7:9)),
  structural  = list(c("F1", "F3"), c("F2", "F3"))
)
plot(m)

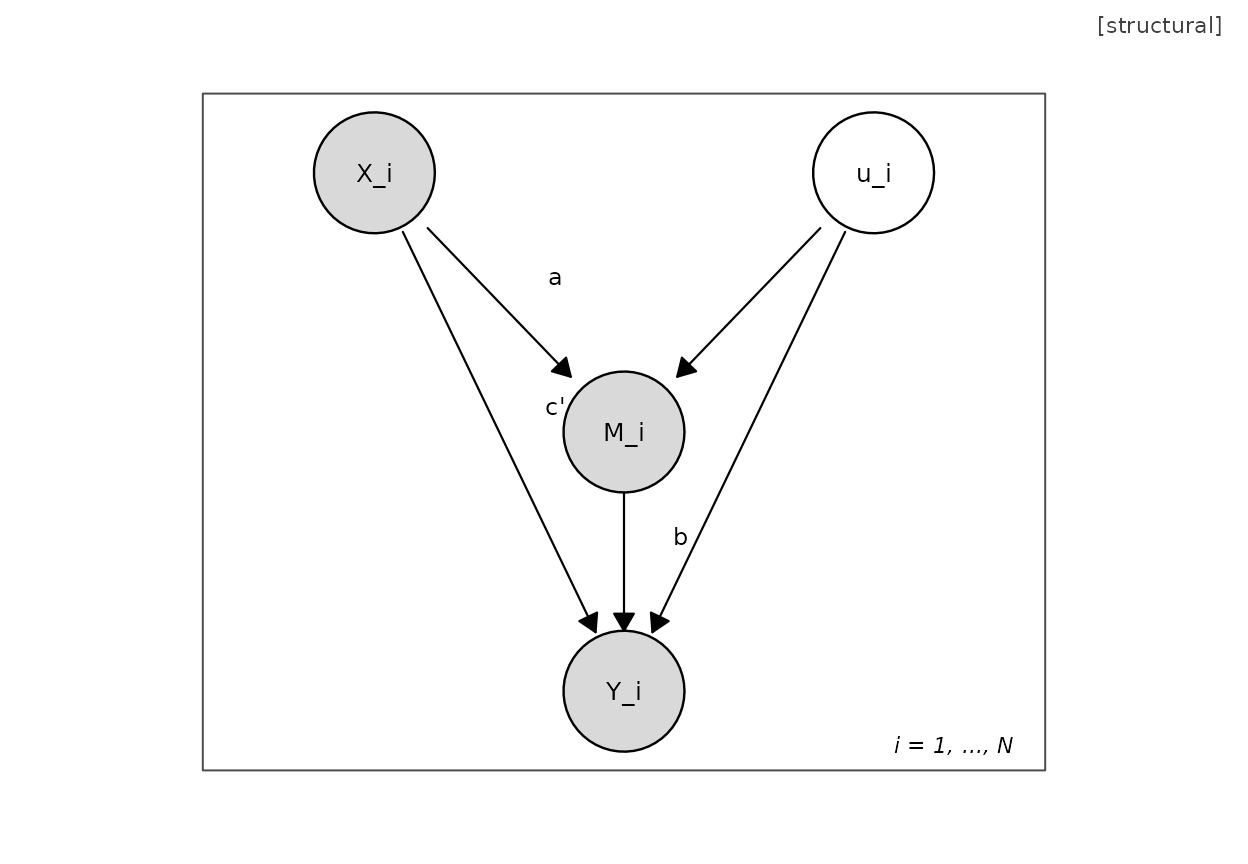
Causal license: the badge

plot(umg_mediation(confounder = TRUE, badge = "structural"))