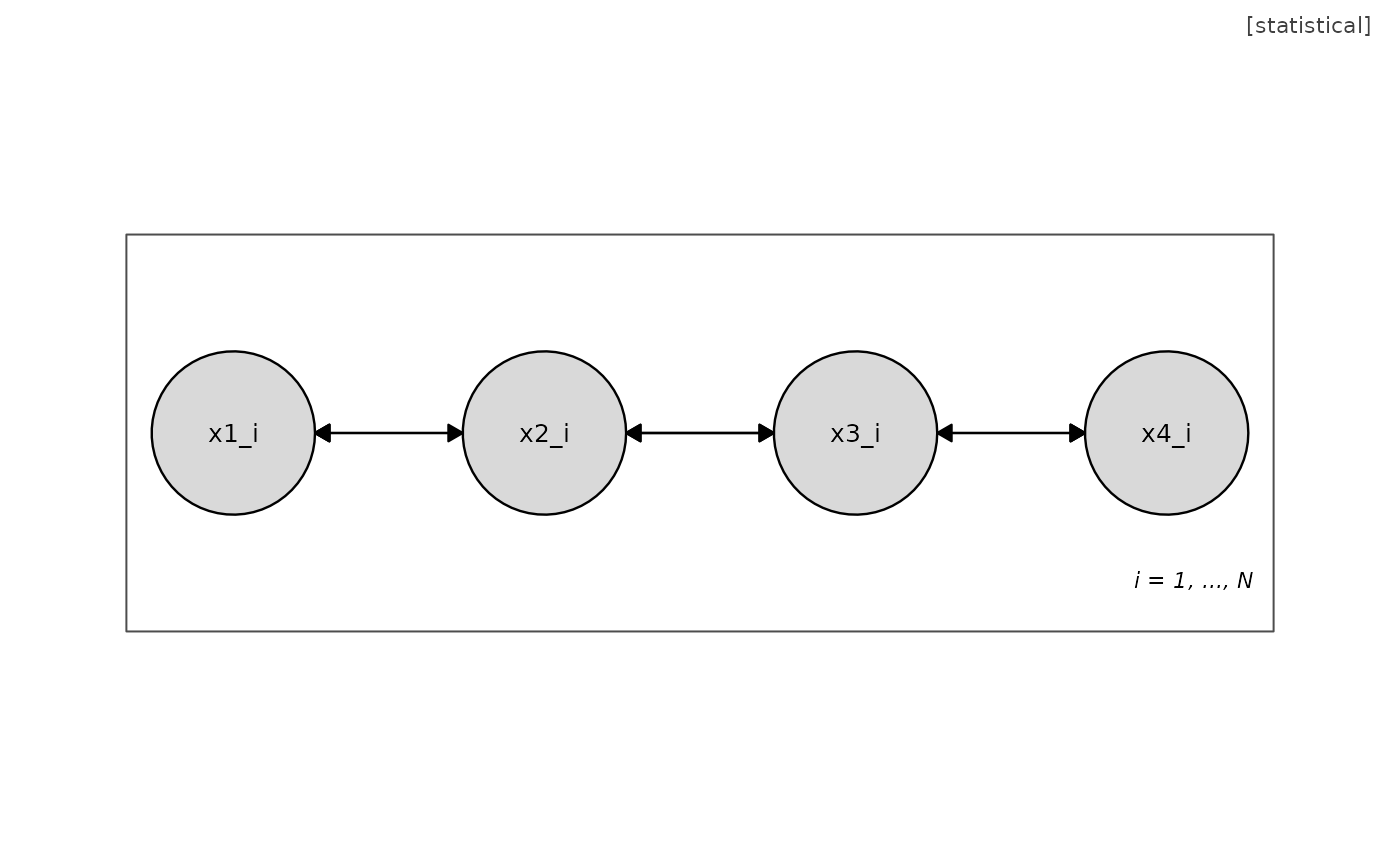
Builds a network-psychometric diagram: observed continuous variables joined by symmetric covariance edges representing the partial-association structure of a Gaussian graphical model.
Usage
umg_network(
  vars = paste0("x", 1:5),
  edges_mat = NULL,
  plate_index = "i = 1, ..., N"
)
Arguments
- vars
Character vector of observed variable names.
- edges_mat
Optional logical or numeric adjacency matrix selecting which pairs are connected; a pair is joined when either the upper- or the lower-triangular entry is nonzero, so upper-, lower-, and fully symmetric encodings are all accepted. Defaults to a fully connected graph.
- plate_index
Index label for the person plate.