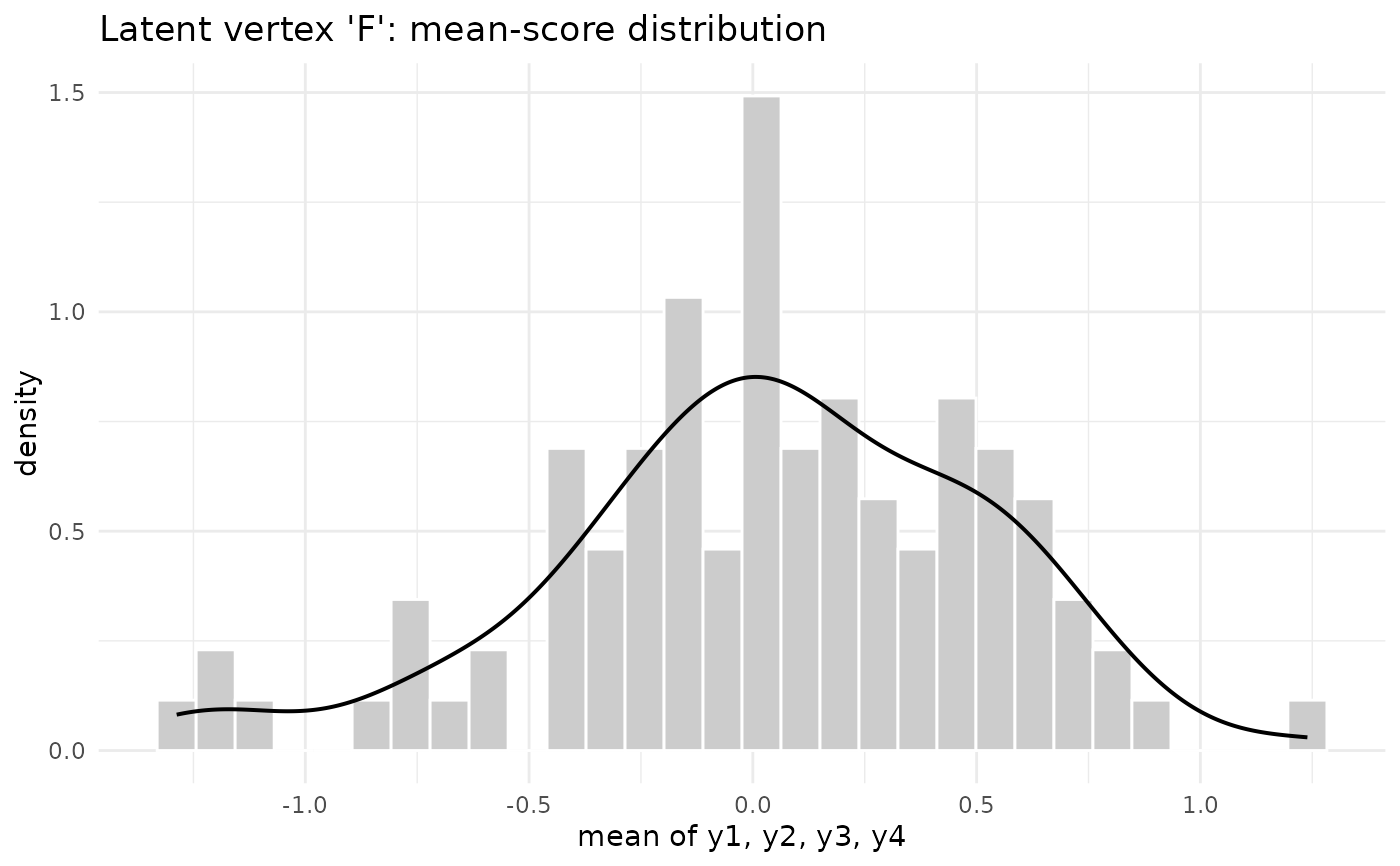
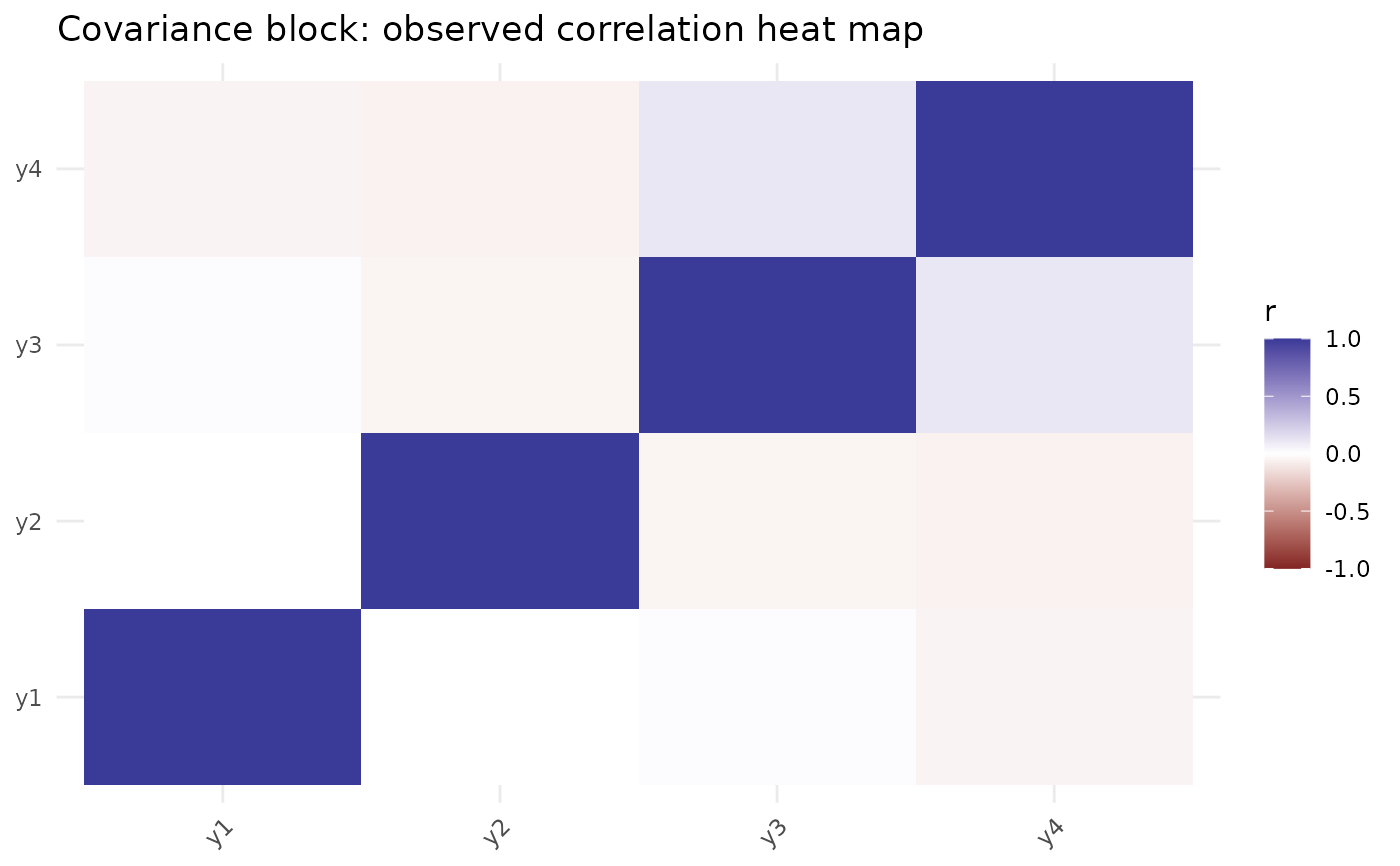
Implements the model-data duality of the UMG grammar (article, Table 3): each motif in the diagram induces a canonical exploratory display. Given a UMG and a data frame, the function returns a named list of ggplot objects: faceted panels for plates whose index variable is found in the data, spaghetti plots for random-coefficient motifs, scatter plots for dep edges between observed continuous vertices, latent-score distributions, mixture densities, empirical response curves, and residual correlation heat maps. The scaffolds are intentionally minimal; they are starting points for exploration, not finished graphics.
Examples
set.seed(1)
m <- umg_factor("F", paste0("y", 1:4))
d <- as.data.frame(matrix(rnorm(400), ncol = 4,
dimnames = list(NULL, paste0("y", 1:4))))
umg_eda_scaffold(m, d)
#> $score_F
 #>
#> $resid_heatmap
#>
#> $resid_heatmap
 #>
#>