Multilevel Modeling
for Psychology and the Social Sciences
Models, Graphs, and Practice
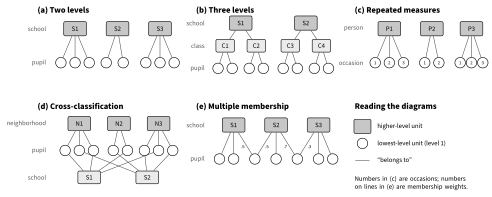
Each level of a multilevel structure has its own units and its own variation. In the three-level empty model of Chapter 8, pupil scores vary around their class mean, class means around their school mean, and school means around the grand mean.
About this book
Data in psychology, education, and the social sciences are almost always grouped. Pupils are taught in classes within schools, patients are treated by therapists within clinics, employees work in teams within firms, and repeated measurements are nested within persons. Multilevel models represent the variation at every level at once, relate it to explanatory variables measured at the corresponding level, and give inferences that respect the dependence the grouping creates.
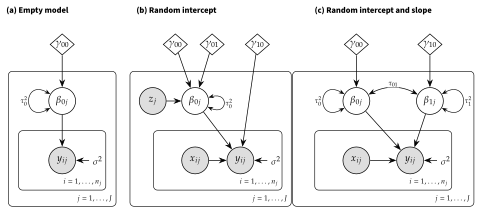
This book develops multilevel modeling from nested data and the random intercept model to growth models, generalized linear mixed models, cross-classified and multiple-membership structures, location-scale models, multilevel structural equation and measurement models, and causal inference with clustered data. Every model is written three ways, as level-specific equations, as a single mixed model, and as a marginal model for the mean and covariance of the outcome, and every model is drawn as a Unified Model Graph before it is fitted.
R carries the worked examples throughout; each chapter closes with a software crosswalk to SAS, SPSS, Stata, Mplus, HLM, and JASP, a chapter summary, key terms, five kinds of exercises, and a pointer to a self-paced lab. Derivations are kept in Technical Detail boxes and in Appendix B, so that the main text can be read at the level of a first graduate course.
Draw before you fit: the UMG lexicon
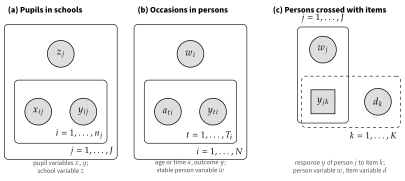
Unified Model Graphs encode each part of a model by one visual channel. Fill shows whether a variable is observed, shape shows its support, the diamond marks a fixed parameter, and plates show replication, so that nested plates are the levels of the hierarchy. The full reference is in Appendix D.
Reading paths
Each core chapter corresponds to roughly one three-hour lecture, and every chapter restates its notation, so the book can be read in several orders.
One-semester graduate course
The course sequence, with Chapters 13, 16, and 17 read as introductions; fourteen content weeks.
Advanced undergraduate course
The core models, inference, model building, and growth, with the Technical Detail boxes omitted.
Second-semester advanced course
Bayesian estimation, design and missing data, intensive longitudinal data, and the extensions of Parts VI and VII.
Reference use
The software crosswalk and troubleshooting guide, together with any chapter, each of which restates its notation.
Contents
Thirty-two chapters in seven parts, followed by seven appendices. The table of contents is also available in the left panel on every page.
Foundations
The Core Models
Estimation and Inference
Building, Checking, Designing, Reporting
Longitudinal and Intensive Data
Generalized and Extended Models
Latent Variables, Causality, Frontiers
Appendices
- AMatrix Algebra and Distribution Refresher
- BLikelihood, REML, and Empirical Bayes Derivations
- CData Set Catalog and Codebooks
- DUMG Notation Reference and Figure Style Guide
- ESoftware Crosswalk: One Model in Every Program, and Troubleshooting
- FGlossary of Terms in English and Traditional Chinese (中英術語對照)
- GSolutions to Selected Exercises
In every chapter
Every chapter follows the same template, so recurring elements are marked the same way throughout the book.
Copyright and use
© 2026 Hsiu-Ting Yu (游琇婷). All rights reserved.
This web edition is provided for personal study and teaching. You are welcome to link to any page and to cite the book as shown under “Cite this book”; reproduction, redistribution, or adaptation of the text, figures, tables, or solutions requires the author’s written permission.
R code examples are released under the MIT License. Data sets remain subject to the terms of their original providers (see Appendix C).