Data Set Catalog and Codebooks
In this appendixfiles, formats, and the scripts that build them; sources, permissions, and citation; an overview of the real data sets; codebooks of the core data sets; the variables of the other data sets; the simulated data sets; the simulation studies; data described but not analyzed.
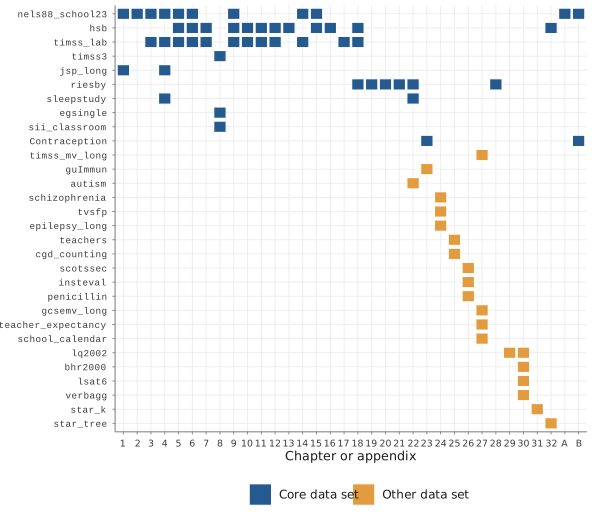
The book uses 30 real data sets, 14 simulated data sets that are distributed as files, and the data of 35 simulation studies, which are not distributed because their scripts regenerate them. This appendix records where each data set comes from, how it was prepared, which chapters use it, and what its variables mean. Figure C.1 shows at a glance which real data sets each chapter uses: a few data sets carry the core chapters, and the chapters on extensions each bring their own. The first 10 rows of the figure are the core data sets, documented variable by variable in Section C.4.
C.1Files, Formats, and Scripts#
The companion repository keeps the data in three folders. Data/ holds one analysis file per data set in two formats with the same content: an R data file (.rds), which preserves variable types and is the file that the book’s scripts read, and a comma-separated copy (.csv) for other programs; the companion files of the simulated data sets are .csv files only, and the scripts read them in that format. Data/raw/ holds the original files from which some analysis files were built, and Data/export/ holds three zip archives with the same data as SPSS (.sav), Stata (.dta), and Mplus (.dat) files: 58 files in each archive, namely the 44 data sets of Tables C.2 and C.5 and 14 companion files, such as the separate pupil and school files of HSB and the true person parameters of the simulated diary data. Data sets that are read directly from an R package, four of the real data sets, have no file in Data/, but they are included in the archives, and the file export_manifest_V01.csv lists the numbers of rows and columns of every exported file. Data/raw/ also keeps three SAS programs of the course (school10-data.sas, How_to_Simulate_Data.sas, and SAS_MergeData.sas) for reference; no script reads them.
Every analysis file is written by a script, never edited by hand. The files of Chapters 1 to 20 are built by the scripts prepare_*_V01.R in Scripts/Shared/, and those introduced in Chapters 21 to 32 by the script data_chNN_*_V01.R of the chapter that introduces them. Each preparation script states its input and the recoding it performs, and the scripts in Scripts/Shared/ also check the result, for example the numbers of units at each level and the constancy of cluster-level variables within clusters. The export archives are written by Scripts/AppC/appC_export_formats_V01.R, which reads every SPSS and Stata file back and compares its dimensions with the source.
In R, a data set is read either from its file or from its package:
book_root <- "path/to/Textbook"                  # the repository folder
hsb <- readRDS(file.path(book_root, "Data", "hsb.rds"))
hsb <- read.csv(file.path(book_root, "Data", "hsb.csv"))      # same content
data(sleepstudy, package = "lme4")               # package-only data sets
In the .csv and .rds files, missing values are NA; in the SPSS and Stata files, they are system-missing; and in the Mplus files, which have no header, they are coded . Each Mplus data file comes with an input stub (.inp) that lists the variable names and the missing-value code and documents the codes of variables that are text or factors in R. Mplus names in the stubs have at most eight characters; nine files have names shortened for this purpose, and the stub lists each original name with its short form. Names containing a period, such as hos.cat, are written with an underscore in the SPSS and Stata files. Before export, identifiers and other categorical variables whose categories are numbers are written as those numbers, variables with two categories are coded 0 and 1 with value labels (for example, N = 0 and Y = 1 for contraceptive use), and other factors keep codes from 1 upward with value labels. Text variables with more than two categories, such as the author names of the meta-analytic data, stay text in the SPSS and Stata files and are left out of the Mplus files, whose stubs list them. SAS reads the SPSS and Stata files with PROC IMPORT where the SAS/ACCESS Interface to PC Files is licensed; the .csv files can also be imported, but their missing values, written as NA, must then be recoded. HLM builds its multivariate data matrix from one file per level, sorted by the cluster identifier; the separate pupil and school files of HSB (hsb_pupils, hsb_schools) and TIMSS (timss_pupils, timss_schools) serve this purpose, and the same split can be made for any other data set by keeping the cluster-level variables once per cluster.
Identifiers deserve attention before any model is fitted (Chapter 4). In most files, the identifier of a unit is unique across clusters. The exceptions are the pupil numbers of NELS:88 and the student numbers of the GCSE data, which restart in each school; the class numbers of the Junior School Project, which restart in each school; the school numbers of the school calendar data, which restart in each district; and, among the simulated data, the member numbers of med211_sim, which restart in each team, and the student numbers of did_sim, which restart in each school and year. In these files, a unit is identified by the combination of its own number and the number of its cluster. None of the files carries sampling weights; the weighting examples of Chapter 17 use simulated populations.
C.2Sources, Permissions, and Citation#
Table C.2 gives the source of each real data set. Of the 30 real data sets, 23 are distributed with R packages (Table C.1) or derived from such data, and seven come from files of the course archive on which this book is based or are derived from them. A user of any data set should cite its original source, given in the Source column of Table C.2, and, for packaged data, the package.
| Package | Version | CRAN | License | Data objects used |
|---|---|---|---|---|
nlme
| 3.1-164 | 3.1-171 | GPL ( 2) | MathAchieve, MathAchSchool |
lme4
| 1.1-35.1 | 2.0-6 | GPL ( 2) | sleepstudy, InstEval, Penicillin, VerbAgg |
mlmRev
| 1.0-9 | 1.0-9 | GPL ( 2) | egsingle, Contraception, guImmun, ScotsSec, Gcsemv, star |
WWGbook
| 1.0.2 | 1.0.2 | GPL ( 2) | classroom, autism |
brms
| 2.23.0 | 2.23.0 | GPL-2 | epilepsy |
survival
| 3.5-8 | 3.8-12 | LGPL ( 2) | cgd |
metadat
| 1.2-0 | 1.6-0 | GPL ( 2) | dat.raudenbush1985, dat.konstantopoulos2011 |
multilevel
| 2.8 | 2.8 | GPL ( 2) | lq2002, bhr2000 |
mirt
| 1.47 | 1.47 | GPL ( 3) | LSAT6 |
mixor
| 1.0.4 (CRAN archive) | 1.0.7 | GPL ( 2) | schizophrenia, SmokingPrevention |
Note. Version: version recorded when the book’s data were prepared. CRAN: current version on CRAN on October 4, 2026; the data objects used in the book are identical in the two versions. License: the license field of the package’s DESCRIPTION file. Data objects used: the R objects read by the book’s scripts. The current mixor requires R 4.6 or later and could not be installed in the book’s computing environment (R 4.3); its data were extracted from the source archive of version 1.0.4. The item response models of Chapter 30 were fitted with lme4 2.0-6.
The licenses in Table C.1 are software licenses of the packages, and none of the packages states separate terms for its data. They do not settle the terms of use of the underlying studies, which remain with the original investigators and agencies. The NELS:88 subsample of Kreft & de Leeuw (1998) is also distributed with the R package influence.ME, whose documentation states that the data are reproduced with permission from Jan de Leeuw (Nieuwenhuis et al., 2012); the course file used in this book agrees with that version on every variable the two share, for all 519 pupils, and the codes of its categorical variables were matched to the labels in that documentation. The other course files were obtained as follows: the Junior School Project file from the website multilevel.ioe.ac.uk of the Centre for Multilevel Modelling, now at the University of Bristol, as its header states; the Riesby file as distributed by Hedeker & Gibbons (2006); the teacher-turnover file from the data page for Singer & Willett (2003) at the UCLA Office of Advanced Research Computing; and the TIMSS lab files from the course’s computer labs. The header of the TIMSS file dates the data to 1997, whereas pupils in grades 3 and 4 were assessed in the 1995 cycle of TIMSS; the course records do not resolve this discrepancy. The course files are kept in the repository for teaching; permission to redistribute them publicly has not yet been obtained from their original distributors, so a public release of the repository would include the preparation scripts and instructions for obtaining the raw files rather than the files themselves.
C.3Overview of the Real Data Sets#
Table C.2 lists the 30 real data sets with their structure, source, and the chapters that use them. The numbers of units are counted in the distributed files, so they can differ from the numbers analyzed in a chapter when a model excludes cases with missing values. Several analyses use subsets that have no file of their own because their scripts draw them from a distributed file. Chapter 3 uses 260 pupils in 10 of the NELS:88 schools (7472, 7829, 7930, 24725, 25456, 25642, 62821, 68448, 68493, and 72292). Figure 5.3 shows 30 HSB schools drawn with seed 5003. Chapters 9 and 10 use random samples of 50 HSB schools and of 20 of these 50, drawn with seed 20261020; Chapter 13 uses a different random sample of 20 schools, drawn with seed 20261320, and, for Figures 13.2 and 13.4, eight schools with 10 pupils each, drawn with seed 6. Chapters 9 and 10 also read a second course file of the TIMSS data, Data/raw/timss_lab2new.txt, which adds to the same pupils their reported time watching television and playing computer games (hoursTV, hourscomputergames; five ordered categories each, 1 = least, 5 = most) and the type of community in which the school is located (community: 1 = geographically isolated, 2 = village or farm area, 3 = outskirts of a town or city, 4 = close to the center of a town or city). Chapter 17 creates missing values in the TIMSS data by a documented random mechanism, with seed 20261701.
| Data set (file) | Structure | Source | Chapters |
|---|---|---|---|
NELS:88, 23 schools (nels88_school23)
| 519 pupils in 23 schools; eighth grade, 1988 | National Education Longitudinal Study of 1988; subsample of Kreft & de Leeuw (1998); also in influence.ME (Nieuwenhuis et al., 2012)
| 1–6, 9, 14, 15, A, B |
High School and Beyond (hsb)
| 7,185 pupils in 160 schools; 1982; 90 public, 70 Catholic schools | Subsample analyzed by Raudenbush & Bryk (2002); nlme::MathAchieve and MathAchSchool (Pinheiro & Bates, 2000)
| 5–7, 9–13, 15, 16, 18, 32 |
TIMSS lab file (timss_lab)
| 7,097 pupils in 146 schools; U.S. pupils, grades 3 and 4 | Course extract of the U.S. sample of the Third International Mathematics and Science Study | 3–7, 9–12, 14, 17, 18 |
TIMSS with classes (timss3)
| 7,097 pupils in 414 classes in 146 schools; derived from timss_lab
| Derived: classes decoded from the pupil identifier | 8 |
Junior School Project (jsp_long)
| 3,236 records in 1,192 pupils in 49 schools; up to three yearly records per pupil | Inner-London primary schools (Mortimore et al., 1988); analyzed by Goldstein (1987) | 1, 4 |
Riesby depression data (riesby)
| 396 occasions in 66 patients; weeks 0 to 5; 375 observed ratings; 21 missing values | Reisby et al. (1977), as distributed by Hedeker & Gibbons (2006) | 18–22, 28 |
Sleep deprivation study (lme4::sleepstudy)
| 180 observations in 18 subjects; days 0 to 9 | Belenky et al. (2003); lme4::sleepstudy (Bates et al., 2015)
| 4, 22 |
Sustaining Effects Study (egsingle)
| 7,230 scores in 1,721 pupils in 60 schools; up to six annual scores | Subset analyzed by Raudenbush & Bryk (2002), Chapter 8; distributed with HLM and mlmRev::egsingle (Bates et al., 2026)
| 8 |
Study of Instructional Improvement (sii_classroom)
| 1,190 pupils in 312 classrooms in 107 schools; first grade; 109 missing values | Hill et al. (2005); WWGbook::classroom (West et al., 2014)
| 8 |
Bangladesh contraception data (mlmRev::Contraception)
| 1,934 women in 60 districts; married women | Bangladesh Fertility Survey (Huq & Cleland, 1990); mlmRev::Contraception
| 23, B |
TIMSS, stacked outcomes (timss_mv_long)
| 14,194 scores in 7,097 pupils in 146 schools; mathematics and science stacked | Derived from timss_lab
| 27 |
Guatemala immunization data (mlmRev::guImmun)
| 2,159 children in 1,595 families in 161 communities | Rodríguez & Goldman (2001); mlmRev::guImmun
| 23 |
Autism socialization data (WWGbook::autism)
| 612 occasions in 158 children; ages 2, 3, 5, 9, 13; 2 missing values | West et al. (2014); WWGbook::autism
| 22 |
NIMH schizophrenia study (schizophrenia)
| 1,603 ratings in 437 patients | Hedeker & Gibbons (1994); mixor 1.0.4 (Hedeker & Gibbons, 1996)
| 24 |
Television smoking prevention project (tvsfp)
| 1,600 students in 135 classrooms in 28 schools; exercise only | Flay et al. (1995); mixor 1.0.4
| 24 |
Progabide epilepsy trial (epilepsy_long)
| 295 counts in 59 patients; baseline and four follow-up periods | Thall & Vail (1990); brms::epilepsy
| 24 |
Special educators’ careers (teachers)
| 3,941 teachers; 24,875 person-years in teachers_pp
| Singer & Willett (2003), Chapter 10 | 25 |
Chronic granulomatous disease trial (cgd_counting)
| 203 intervals in 128 patients in 13 hospitals; counting-process format | International Chronic Granulomatous Disease Cooperative Study Group (1991); survival::cgd (Therneau & Grambsch, 2000)
| 25 |
Scottish secondary schools (scotssec)
| 3,435 students; 148 primary schools 19 secondary schools (crossed) | Paterson (1991); mlmRev::ScotsSec
| 26 |
ETH lecture evaluations (insteval)
| 73,421 ratings; 2,972 students 1,128 instructors (crossed); 14 departments | lme4::InstEval (Bates et al., 2015)
| 26 |
Penicillin assay (penicillin)
| 144 observations; 24 plates 6 samples (crossed) | Davies & Goldsmith (1972); lme4::Penicillin
| 26 |
GCSE written and coursework scores (gcsemv_long)
| 3,428 scores in 1,905 students in 73 schools; two outcomes stacked | mlmRev::Gcsemv
| 27 |
Teacher expectancy experiments (teacher_expectancy)
| 19 studies; meta-analysis | Raudenbush (1984); metadat (White et al., 2022)
| 27 |
Modified school calendars (school_calendar)
| 56 studies in 11 districts; meta-analysis | Konstantopoulos (2011); metadat (White et al., 2022)
| 27 |
U.S. Army soldiers in Haiti (lq2002)
| 2,042 soldiers in 49 companies | P. D. Bliese et al. (2002); multilevel (P. Bliese, 2026)
| 29, 30 |
U.S. Army leadership and work hours (bhr2000)
| 5,400 soldiers in 99 companies | P. D. Bliese & Halverson (1996); multilevel (P. Bliese, 2026)
| 30 |
LSAT Section 6 (lsat6)
| 1,000 examinees; five binary items | Thissen (1982); mirt::LSAT6
| 30 |
Verbal aggression data (verbagg)
| 7,584 responses; 316 persons 24 items (crossed) | De Boeck & Wilson (2004); lme4::VerbAgg
| 30 |
Tennessee STAR, kindergarten (star_k)
| 5,871 students in 337 classes in 79 schools; 18 missing values | Finn & Achilles (1990; Krueger, 1999); mlmRev::star
| 31 |
Tennessee STAR, small and regular classes (star_tree)
| 3,784 students in 225 classes in 79 schools; complete moderators | As star_k
| 32 |
C.4Codebooks of the Core Data Sets#
The 10 core data sets carry the running examples of the core chapters. Table C.3 documents every variable in their files, 97 variables in all, with the level at which each variable varies, its meaning, and its codes or range. The paragraphs below add what a table cannot: how each file was prepared and what a reader should know before analyzing it.
NELS:88, 23 schools. The National Education Longitudinal Study of 1988 surveyed eighth-grade pupils in the spring of 1988; the subsample of Kreft & de Leeuw (1998) contains 519 pupils in 23 schools. The outcome is a mathematics test score. The homework variable is an ordered category of weekly time on mathematics homework, not a number of hours: its categories are unequally spaced in time, so a slope for homework is a difference per category. The indicators female, white, and public are derived in the preparation script; school means and school-centered versions of SES and homework are computed in the analysis scripts that use them.
High School and Beyond. The HSB file combines the pupil and school files of Raudenbush & Bryk (2002) as distributed with nlme (Pinheiro & Bates, 2000): 7,185 pupils in 160 U.S. high schools surveyed in 1982, with mathematics achievement as the outcome. The file contains two versions of the school mean SES. The variable meanses is the mean of ses over the sampled pupils, and ses_cwc is SES centered at it; meanses_rb is the value distributed with the data, which exceeds the sample mean by 0.0055 to 0.0065 in every school. Chapters 5 to 7, 18, and 32 use the sample mean; some tables of Chapters 9 to 13 and 15 use the distributed value, as their scripts show. Because the two versions differ by a nearly constant amount, the coefficients of these variables are almost the same under either version, whereas the intercept shifts slightly.
TIMSS lab file. The course file contains the science and mathematics scores, in the metric of the course file, of 7,097 U.S. pupils in grades 3 and 4 in 146 schools, and one school characteristic, the principal’s rating of the shortage of instructional materials. It is distributed as a merged file and, for the merging exercise of Chapter 4, as separate pupil and school files. The file timss3 adds the class, decoded from the pupil identifier, and the class and school means of mathematics used in the three-level models of Chapter 8; it keeps the numeric versions girl and shortages of gender and the shortage rating.
Junior School Project. The long file has one record per pupil and year for 1,192 pupils in 49 inner-London primary schools (Mortimore et al., 1988), with mathematics scores in up to three years; the wide file jsp_wide has one row per pupil, with the scores as math0, math1, and math2. Chapter 1 uses the 1,093 pupils with scores in the first two years. The other variables of the source file are kept as they are and are not used in this book.
Riesby depression data. The file has 66 patients, each scheduled for six weekly ratings on the Hamilton Depression Rating Scale (weeks 0 to 5); 375 of the 396 scheduled ratings are observed, 46 patients have all six, and 37 have endogenous depression (Hedeker & Gibbons, 2006; Reisby et al., 1977). Missing ratings are kept as NA so that the file shows which ratings are missing; the analysis scripts remove them. The plasma drug levels measured in the study are not part of the course file.
Sleep deprivation study, Sustaining Effects Study, and Study of Instructional Improvement. The sleep study data are used as distributed with lme4: reaction times of 18 subjects on 10 consecutive days, perfectly balanced (Belenky et al., 2003). The Sustaining Effects Study file is mlmRev::egsingle with its two-category factors recoded as 0 and 1 and its identifiers stored as text: up to six annual mathematics scores of pupils in 60 schools, with the year of the test centered. The SII file is WWGbook::classroom (West et al., 2014): first-grade pupils in classrooms in schools, with the gain in mathematics as the outcome; the teacher’s mathematics knowledge is missing for 109 pupils.
Bangladesh contraception data. The data are used as distributed with mlmRev: 1,934 married women in 60 districts (Huq & Cleland, 1990). Age is centered at the mean in the distributed file; the analysis scripts rescale it to decades, add its square, reduce the number of living children to an indicator of having any, and code urban residence as 0 and 1.
| Variable | Level | Description | Values |
|---|---|---|---|
A. NELS:88, 23 schools (nels88_school23)
| |||
school
| school | School identifier (NELS:88 school number) | 23 values |
student
| pupil | Pupil number (restarts in each school) | 0 to 99 |
sex
| pupil | Sex | 1 = male, 2 = female |
race
| pupil | Race or ethnicity | 1 = Asian, 2 = Hispanic, 3 = Black, 4 = White, 5 = American Indian |
homework
| pupil | Weekly time on mathematics homework | 0 = none, 1 = less than 1 hour, 2 = 1 hour, 3 = 2 hours, 4 = 3 hours, 5 = 4–6 hours, 6 = 7–9 hours, 7 = 10 hours or more |
schtype
| school | School type | 1 = public, 2 = Catholic, 3 = private with another religious affiliation, 4 = private without religious affiliation |
ses
| pupil | Socioeconomic status (composite score) | 2.41 to 1.85 |
pared
| pupil | Parents’ highest education | 1 = did not finish high school, 2 = high school or GED, 3 = more than high school but less than a 4-year degree, 4 = college graduate, 5 = M.A. or equivalent, 6 = Ph.D., M.D., or other |
math
| pupil | Mathematics test score | 30 to 71 |
classstr
| school | Structure of the classroom environment (higher = more structured) | 2 to 5 |
schsize
| school | School enrollment | 1 = 1–199, 2 = 200–399, 3 = 400–599, 4 = 600–799, 5 = 800–999, 6 = 1,000–1,199, 7 = 1,200 or more |
urban
| school | Urbanicity | 1 = urban, 2 = suburban, 3 = rural |
geo
| school | Region | 1 = Northeast, 2 = North Central, 3 = South, 4 = West (not present) |
minority
| school | Percentage of minority pupils in the school | 0 = none, 1 = 1–5, 2 = 6–10, 3 = 11–20, 4 = 21–40 (not present), 5 = 41–60, 6 = 61–90, 7 = 91–100 |
ratio
| school | Student-teacher ratio | 10 to 28 |
female
| pupil | Female (derived from sex) | 0 = male, 1 = female |
white
| pupil | White (derived from race) | 0 = other, 1 = White |
public
| school | Public school (derived from schtype) | 0 = private, 1 = public |
B. High School and Beyond (hsb)
| |||
school
| school | School identifier | 160 values |
minority
| pupil | Pupil belongs to a racial or ethnic minority | 0 = no, 1 = yes |
female
| pupil | Female | 0 = male, 1 = female |
ses
| pupil | Socioeconomic status (standardized composite) | 3.76 to 2.69 |
mathach
| pupil | Mathematics achievement | 2.83 to 24.99 |
size
| school | School enrollment | 100 to 2,713 |
catholic
| school | Sector | 0 = public, 1 = Catholic |
pracad
| school | Proportion of students in the academic track | 0.00 to 1.00 |
disclim
| school | Disciplinary climate (school scale) | 2.42 to 2.76 |
himinty
| school | High-minority school (more than 40% minority pupils) | 0 = no, 1 = yes |
meanses_rb
| school | School mean SES as distributed (MEANSES)
| 1.19 to 0.83 |
n_j
| school | Number of sampled pupils in the school (derived) | 14 to 67 |
meanses
| school | Sample mean of ses in the school (derived)
| 1.19 to 0.82 |
ses_cwc
| pupil | ses minus meanses (derived)
| 3.65 to 2.86 |
C. TIMSS lab file (timss_lab)
| |||
idschool
| school | School identifier | 146 values |
idstud
| pupil | Pupil identifier (the digits before the last two identify the class) | 7,097 values |
grade
| pupil | Grade | 3 or 4 |
gender
| pupil | Gender | boy, girl |
girl
| pupil | Girl (derived from gender) | 0 = boy, 1 = girl |
science
| pupil | Science score (course-file metric) | 103.4 to 185.0 |
math
| pupil | Mathematics score (course-file metric) | 104.3 to 189.0 |
gen_short
| school | Principal’s rating of shortage of instructional materials | none, a_little, some, a_lot |
shortages
| school | Numeric version of gen_short (derived)
| 0 = none, 1 = a little, 2 = some, 3 = a lot |
D. Variables added in timss3
| |||
class
| class | Class identifier (derived: integer part of idstud/100)
| 414 values |
grade4
| class | Grade 4 (derived) | 0 = grade 3, 1 = grade 4 |
math_cls
| class | Class mean of math (derived)
| 121.5 to 165.9 |
math_sch
| school | School mean of math (derived)
| 133.5 to 162.6 |
math_wc
| pupil | math minus the class mean (derived)
| 35.83 to 41.44 |
cls_ws
| class | Class mean minus school mean (derived) | 11.98 to 10.76 |
math_sch_c
| school | School mean minus the grand mean (derived) | 17.61 to 11.49 |
n_class
| class | Number of pupils in the class (derived) | 1 to 30 |
n_school
| school | Number of pupils in the school (derived) | 7 to 83 |
k_classes
| school | Number of classes in the school (derived) | 1 to 8 |
E. Junior School Project (jsp_long)
| |||
school
| school | School identifier | 49 values |
class
| pupil | Class number within school (not used in this book) | 1 to 4 |
gender
| pupil | Gender as coded in the source file (not used in this book) | 0, 1 (labels not given in the source file) |
soclass
| pupil | Social class as coded in the source file (not used in this book) | 1 to 9 |
ravens
| pupil | Raven’s test score as named in the source file (not used in this book) | 4 to 36 |
id
| pupil | Pupil identifier (unique across schools) | 1,192 values |
english
| occasion | English test score as named in the source file (not used in this book) | 0 to 98 |
math
| occasion | Mathematics test score | 1 to 40 |
jsyear
| occasion | Year of junior school | 0, 1, 2 |
F. Riesby depression data (riesby)
| |||
id
| patient | Patient identifier | 66 values |
week
| occasion | Week of the study | 0, 1 = drug-free; 2 to 5 = imipramine |
hamd
| occasion | Hamilton Depression Rating Scale total score | 0 to 39 (21 missing) |
endog
| patient | Type of depression | 0 = nonendogenous, 1 = endogenous |
G. Sleep deprivation study (lme4::sleepstudy)
| |||
Reaction
| occasion | Average reaction time (ms) | 194.3 to 466.4 |
Days
| occasion | Day of the study (days 0 and 1: adaptation and training; day 2: baseline; sleep deprivation after day 2) | 0 to 9 |
Subject
| subject | Subject identifier | 18 values |
H. Sustaining Effects Study (egsingle)
| |||
schoolid
| school | School identifier | 60 values |
childid
| pupil | Pupil identifier | 1,721 values |
year
| occasion | Year of the test (centered) | 2.50 to 2.50 |
grade
| occasion | Grade | 0 to 5 |
math
| occasion | Mathematics score (IRT scale) | 5.22 to 5.77 |
retained
| occasion | Pupil was retained in a grade | 0 = no, 1 = yes |
female
| pupil | Female | 0 = male, 1 = female |
black
| pupil | Black | 0 = no, 1 = yes |
hispanic
| pupil | Hispanic | 0 = no, 1 = yes |
size
| school | School enrollment | 113 to 1,486 |
lowinc
| school | Percentage of low-income pupils in the school | 0.0 to 100.0 |
mobility
| school | School mobility (undocumented in mlmRev; not used in this book)
| 8.80 to 67.00 |
I. Study of Instructional Improvement (sii_classroom)
| |||
schoolid
| school | School identifier | 107 values |
classid
| classroom | Classroom identifier | 312 values |
childid
| pupil | Pupil identifier | 1,190 values |
sex
| pupil | Sex | 0 = boy, 1 = girl |
minority
| pupil | Minority pupil | 0 = no, 1 = yes |
ses
| pupil | Socioeconomic status | 1.61 to 3.21 |
mathkind
| pupil | Mathematics score in the spring of kindergarten | 290 to 629 |
mathgain
| pupil | Gain in mathematics from kindergarten to first grade | 110 to 253 |
yearstea
| classroom | Teacher’s years of teaching experience | 0.00 to 40.00 |
mathknow
| classroom | Teacher’s mathematics content knowledge | 2.50 to 2.61 (109 missing) |
mathprep
| classroom | Teacher’s mathematics preparation (number of courses) | 1.00 to 6.00 |
housepov
| school | Proportion of households below the poverty level in the school’s neighborhood | 0.01 to 0.56 |
J. Bangladesh contraception data (mlmRev::Contraception)
| |||
woman
| woman | Woman identifier | 1,934 values |
district
| district | District identifier | 60 values |
use
| woman | Contraceptive use at the time of the survey | N = no, Y = yes |
livch
| woman | Number of living children | 0, 1, 2, 3+ |
age
| woman | Age in years (centered at the mean) | 13.56 to 19.44 |
urban
| woman | Urban residence | N = no, Y = yes |
C.5The Other Real Data Sets#
Table C.4 lists the variables that the book uses from the other 20 real data sets; the documentation of each package describes the remaining variables. Most files are the package data with at most a few derived variables, but four were restructured. The epilepsy data, which have one row per patient and follow-up visit with the baseline count as a column, received the eight-week baseline count as an additional row (period 0), with the length of each period as the exposure. The LSAT data were expanded from a table of response patterns and their frequencies to one row per examinee. The GCSE data were stacked into one row per student and outcome, without the missing scores. The teacher data are distributed both with one row per teacher and in the person-period format of Chapter 25. The schizophrenia and smoking prevention data were extracted from the source archive of mixor 1.0.4 (Hedeker & Gibbons, 1996), because the current version, 1.0.7, requires R 4.6 or later (Table C.1); the data of the two versions are identical. The smoking prevention file is used only in an exercise.
| Data set (file) | Variables used in the book |
|---|---|
TIMSS, stacked outcomes (timss_mv_long)
| score = scale score; dv = outcome indicator (mathematics or science); grade4; girl; idstud; idschool
|
Guatemala immunization data (mlmRev::guImmun)
| immun = complete set of immunizations; kid2p = child 2 years or older; mom25p = mother 25 years or older; ord = birth order; ethn = mother’s ethnicity; momEd, husEd = education of mother and husband; momWork = mother ever worked outside the home; rural; pcInd81 = proportion indigenous in the community in 1981; kid, mom, comm = child, family, community
|
Autism socialization data (WWGbook::autism)
| vsae = Vineland Socialization Age Equivalent; age = age in years; sicdegp = expressive language group at age 2 (1 = low, 2 = medium, 3 = high); childid
|
NIMH schizophrenia study (schizophrenia)
| sev and sevf = severity of illness in four ordered categories (from item 79 of the Inpatient Multidimensional Psychiatric Scale, imps79); drug = antipsychotic drug (1) or placebo (0); week; sweek = square root of week; id
|
Television smoking prevention project (tvsfp)
| thks = tobacco and health knowledge after the intervention (four ordered categories); thkspre = knowledge before; cc = classroom curriculum; tv = television intervention; class; school
|
Progabide epilepsy trial (epilepsy_long)
| count = number of seizures; weeks = length of the period (offset); period = 0 baseline, 1 after randomization; trt = progabide (1) or placebo (0); visit; age; obs = observation (for an observation-level random effect); patient
|
Special educators’ careers (teachers)
| t = last year observed; censor = 1 if still teaching at the end of data collection; person-year file: year, event = left teaching in that year; id
|
Chronic granulomatous disease trial (cgd_counting)
| tstart, tstop = start and end of the interval; status = 1 if the interval ends with a serious infection; treat = gamma interferon or placebo; enum = interval number; sex, age, inherit, steroids, propylac, hos.cat; id; center = hospital
|
Scottish secondary schools (scotssec)
| attain = attainment score at age 16; verbal = verbal reasoning at entry to secondary school (verbal_c centered); sex (female); social = social class; primary, second = primary and secondary school
|
ETH lecture evaluations (insteval)
| y = rating from 1 (poor) to 5 (very good); s = student; d = instructor; dept = department; service = lecture for another department; studage, lectage = semesters enrolled and semesters since the lecture
|
Penicillin assay (penicillin)
| diameter = diameter of the zone of growth inhibition; plate; sample
|
GCSE written and coursework scores (gcsemv_long)
| score = total score; dv = written paper or coursework; female (gender); id = student (school and student number); school
|
Teacher expectancy experiments (teacher_expectancy)
| yi = standardized mean difference; vi = sampling variance; weeks = weeks of teacher-pupil contact before the expectancy induction (weeks_c = weeks truncated at 3); study, author, year, setting, tester, n1i, n2i
|
Modified school calendars (school_calendar)
| yi = standardized mean difference; vi = sampling variance; district; school (numbered within district); study; year
|
U.S. Army soldiers in Haiti (lq2002)
| LEAD01 to LEAD11 = leadership climate items; TSIG01 to TSIG03 = task significance items; HOSTIL01 to HOSTIL05 = hostility items; LEAD, TSIG, HOSTILE = scale scores; G- and W-prefixed versions = company means and within-company deviations (derived); COMPID = company; SUB = soldier
|
U.S. Army leadership and work hours (bhr2000)
| AF06 to AS28 = 11 leadership items (officers and NCOs); NCO, OFF, LEAD = item means (derived); HRS = hours usually worked per day; RELIG = strength or comfort from religious beliefs; GRP = company
|
LSAT Section 6 (lsat6)
| Item_1 to Item_5 = correct (1) or incorrect (0); person (derived)
|
Verbal aggression data (verbagg)
| y = yes or perhaps (1) versus no (0); resp = no, perhaps, yes; Anger = trait anger; Gender; btype = curse, scold, shout; situ = other or self to blame; mode = want or do; item; id
|
Tennessee STAR, kindergarten (star_k)
| math = mathematics scaled score; cltype = small, regular, or regular with aide (small, aide indicators); freelunch; female; black; schtype = inner city, suburban, rural, urban; id; tch = class (teacher); sch = school
|
Tennessee STAR, small and regular classes (star_tree)
| math; small = small (1) or regular (0) class; freelunch, female, black = factors with levels no and yes; schtype; texp = teacher’s years of experience; tdeg_ma = teacher holds a master’s degree or higher; id; tch; sch
|
C.6Simulated Data Sets#
Where no suitable public data set was available, or where the true values of the parameters had to be known, chapters use simulated data. The 14 simulated data sets in Table C.5 are distributed as files, so that an exercise can use them without running the generating script, and each is reproduced exactly by its script with the stated seed. Several files come with a companion file of true values or of the higher-level units: diary_sim_persons, mood_sim_persons, and esm_sim_persons contain each person’s true parameters; mlirt_sim_schools and mm_sim_schools contain the schools; mm_sim_membership contains the membership weights; dyads_sim_dyad has one row per couple; and dropout_sim_students has one row per student. A few figures and tables use small illustrative data generated inside their own scripts; these are reproduced by rerunning the script and are not distributed separately.
| File | Structure | Design | Script and seed | Ch. |
|---|---|---|---|---|
diary_sim
| 2,495 days in 100 persons | Daily stress and negative affect; random within-person slopes moderated by neuroticism; 10% of days deleted at random | data_ch21_simulated
| 21 |
mood_sim
| 2,800 days in 100 persons | Daily mood following a multilevel first-order autoregressive process with person-specific means, autoregression, and residual variances | data_ch21_simulated
| 21 |
track_sim
| 2,522 students in 100 schools | Choice among academic, vocational, and junior-college tracks; correlated school effects on two baseline-category logits | data_ch24_prepare
| 24 |
aggression_sim
| 1,176 children in 60 classrooms | Counts of aggressive acts with structural zeros and negative binomial counts; observation sessions as exposure | data_ch24_prepare
| 24 |
dropout_sim_pp
| 12,300 person-semesters in 2,393 students in 60 schools | Discrete-time dropout over six semesters with school frailties and random transfer | data_ch25_prepare
| 25 |
rt_sim
| 1,600 responses; 40 participants 40 items (crossed) | Reaction times of participants crossed with words of high and low frequency | data_ch26_prepare
| 26 |
mm_sim_students
| 2,400 students; 60 schools (multiple membership) | Students moving among junior high schools; multiple-membership weights in mm_sim_membership.csv
| data_ch26_prepare
| 26 |
dyads_sim_pairwise
| 360 parents in 180 couples | Mothers and fathers; actor and partner effects of parenting stress | data_ch27_prepare
| 27 |
esm_sim
| 6,000 prompts in 150 persons | Experience sampling with a random location and a random scale correlated at .40 | data_ch28_prepare
| 28 |
med211_sim
| 2,400 members in 300 teams | Team-level predictor, individual mediator and outcome (2-1-1 mediation) | data_ch29_prepare
| 29 |
mlirt_sim
| 24,000 responses in 2,000 students in 80 schools | 12 binary items with differential item functioning of one item by school curriculum | data_ch30_prepare
| 30 |
confound_sim
| 2,000 units in 100 clusters | Treatment confounded by an unobserved cluster characteristic; true effect 0.3 | data_ch31_prepare
| 31 |
did_sim
| 2,000 students in 40 schools | Repeated cross-sections of students in two years; 20 schools adopt a program in year 1 | data_ch31_prepare
| 31 |
scale_sim
| 100,000 observations in 2,000 clusters | Random intercept and slope model for timing comparisons | data_ch32_prepare
| 32 |
C.7Simulation Studies#
The 35 simulation studies of 31 chapters (Table C.6) follow the simulation template introduced in Chapter 4, except for two supplementary runs, sim_ch28_design_V02.R and sim_ch29_mediation_J_V02.R, which write their own summaries and have no analysis script. Each of the other studies has a simulation script, sim_chNN_*_V01.R or _V02.R, and an analysis script with the corresponding name, analysis_chNN_*; a _V02 simulation script regenerates data sets of the _V01 script from the same seeds and refits them with several optimizers or starting values, and in Chapter 19 it also adds replications with new seeds. The simulation script saves the results of each condition as soon as the condition is finished, skips finished conditions when it is restarted, and writes the results of every replication as .rds and .csv files in Results/ChNN/; the analysis script reads these files and produces the tables and figures. The replication-level results are therefore available without rerunning a study, and the seeds in Table C.6 reproduce the generated data exactly under the same versions of R and the packages. The number of replications per condition ranges from 100 to 5,000, and differences between conditions are judged against their Monte Carlo standard errors; differences within about two Monte Carlo standard errors are not read as trends. The parametric bootstrap of Chapter 10, with 5,000 samples drawn from a model fitted to the HSB data, is part of a data analysis and is not counted as a simulation study.
| Ch. | Name | Question | Conditions | Seed | |
|---|---|---|---|---|---|
| 1 | typeI
| Type I error of OLS versus a cluster-level test | ICC (4) cluster size (4); | 5,000 | 20260925 (a) |
| 3 | twostage
| Two-stage, pooled OLS, and mixed-model estimates | balance (2) (2); | 1,000 | 20260926 (a) |
| 4 | template
| Simulation template (random intercept versus slope models) | (2) (2) | 500 | 20260927 (b) |
| 5 | compromise
| Raw-predictor slope as a compromise | (5) (2); | 200 | 20260928 (b) |
| 6 | crosslevel
| Cross-level interaction without a random slope | (2) (3); | 500 | 20260929 (b) |
| 7 | contextual
| Manifest versus latent contextual effect | (3) ICC of (2); | 200 | 20260930 (b) |
| 8 | ignore_level
| Ignoring a level | classes per school (2) class variance (2); 30 schools | 500 | 20261008 (b) |
| 9 | ml_reml
| ML versus REML | (3) model (3) | 500 | 20261015 (b) |
| 10 | smallsample
| Small-sample tests of fixed effects | (3) variance scenario (2); | 1,000 | 20261101 (b) |
| 11 | boundary
| Likelihood-ratio tests on the boundary | tested component (2) (2); | 1,000 | 20261201 (b) |
| 12 | eb
| Empirical Bayes estimates and their standard errors | (4) with ; (4) with | 500 | 20261301 (b) |
| 13 | fewclusters
| REML versus Bayesian estimation with few clusters | (3); ; two priors | 200 | 20261310 (c) |
| 14 | maximal
| Maximal, parsimonious, and data-driven random parts | (3) (2); , | 1,000 | 20261410 (c) |
| 15 | misspec
| Consequences of misspecification | design (3) (2); | 500 | 20261500 (c) |
| 16 | power
| Simulated versus analytic power | (5) (3) | 500 | 20261600 (c) |
| 17 | missing
| Multilevel multiple imputation | (2); ; five methods | 300 | 20261700 (c) |
| 17 | weights
| Sampling weights | expected (2); finite population of 500 schools | 100 | 20267000 (c) |
| 18 | selfcheck
| Self-consistency check of the final HSB model | observed HSB design | 500 | 20261800 (d) |
| 19 | dropout
| Growth estimates under dropout | MCAR, MAR, MNAR; 100 patients | 5,000 | 20261900 (c) (e) |
| 20 | serial
| Serial correlation versus random slopes | generating model (4) (2); 100 persons | 500 | 20262000 (c) |
| 21 | nickell
| Nickell bias in multilevel autoregression | (4) (2); 100 persons | 200 | 20262100 (c) |
| 22 | gmm
| Class enumeration in growth mixture models | slope distribution (2); 300 persons | 100 | 20262200 (c) |
| 23 | estimation
| PQL, Laplace, and adaptive quadrature | nine combinations of , , and | 500 | 20262300 (c) |
| 24 | overdispersion
| Sources of overdispersion | level-1 heterogeneity (3); , | 500 | 20262400 (c) |
| 25 | frailty
| Ignoring cluster frailty | (2) (2) | 300 | 20262500 (c) |
| 26 | stimuli
| Type I error when stimuli are treated as fixed | items (2) item SD (3); 30 participants | 1,000 | 20262600 (c) |
| 26 | mm
| Ignoring multiple membership | proportion of movers (3) | 1,000 | 20262610 (c) |
| 27 | dependent
| Dependent effect sizes | studies (2) correlation (2) | 1,000 | 20262700 (c) |
| 28 | scale
| Occasions needed for a random scale | occasions (3); 100 persons | 500 | 20262810 (c) |
| 28 | design
| Many persons or many occasions at a fixed total of 1,500 observations | persons occasions (2): 300 5, 50 30 | 200 | 20262810 (c) |
| 29 | mediation
| Multilevel mediation estimators | (3) ICC (2); | 500 | 20262910 (c) |
| 29 | mediation_J
| Bias of the observed-means between indirect effect as grows | (3) (, ICC) (2) | 300 | 20263100 (f) |
| 30 | laplace
| Laplace approximation for the Rasch model | items (3) person SD (2); 500 persons | 500 | 20263010 (c) |
| 31 | confounding
| Estimators under cluster confounding | (3); | 500 | 20263110 (c) |
| 32 | approaches
| Six analyses in three scenarios | scenario (3); | 1,000 | 20263210 (c) |
C.8Data Described but Not Analyzed#
Some data sets appear in the book without being analyzed. The Taiwan Case boxes use Taiwanese surveys, among them the Taiwan Education Panel Survey (TEPS), the Taiwan Assessment of Student Achievement (TASA), the Taiwanese samples of PISA, TIMSS, and PIRLS, the Comprehensive Assessment Program for Junior High School Students, and the Taiwan Youth Project, as designs to think with: they show how the levels, sampling, and measurement of a real study shape the analysis, but no data from these studies are analyzed in this book, and their access conditions must be checked with the archives or agencies that distribute them. A few exercises point to data that are not in the repository: the Taiwanese PISA sample (Chapter 17), the adolescent mood data distributed with MIXREGLS (Hedeker & Nordgren, 2013) (Chapter 28), and the reading scores and first-grade records of the STAR experiment (Chapters 31 and 32), which are part of mlmRev::star and can be prepared like star_k and star_tree. Chapter 18 describes the data of past final examinations of the course only in words; their provenance and permission for redistribution have not been confirmed.